
Figure 1, Horn, et al. (2018)

Detailed Description
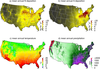
Gradients of N deposition, S deposition, mean annual temperature, and mean annual precipitation across the conterminous U.S. Panels are the a) mean total N deposition from 2000–2012, b) mean total S deposition from 2000–2012, c) mean annual temperature from 2000–2014, and d) mean annual precipitation form 2000–2014. Deposition data are from the TDEP product [23] and climate data are from PRISM (http://prism.oregonstate.edu). The averages for each tree in the analysis were a subset of these datasets that coincided with its measurement interval. The values used in the species-level empirical models correspond to the spatial distribution of the species.
Sources/Usage
Public Domain.