
Graph of Total Dissolved Solids vs VOC Concentrations

Detailed Description
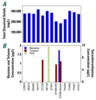
The concentration of total dissolved solids in milligrams per liter (mg/L) (A) and concentration of three volatile organic compounds (benzene, toluene, and tetrachloroethylene) in micrograms per liter (µg/L) (B) in the produced waters USGS scientists collected from 13 shale gas wells in north central Pennsylvania. Graph modified from Akob and others, 2015.
Sources/Usage
Public Domain.