
Graphic indicating the linkage between species richness maps and the B

Detailed Description
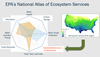
Graphic indicating the linkage between species richness maps and the Biodiversity Metric in EnviroAtlas. Species richness maps based on the USGS GAP species range and habitat distribution maps are central to the Biodiversity Metrics used in EPA’s EnviroAtlas.
Boykin, K.G., Kepner, W.G., Bradford, D.F., Guy, R.K., Kopp, D.A., Leimer, A.K., Samson, E.A., East, N.F., Neale, A.C., Gergely, K.J., 2013, A national approach for mapping and quantifying habitat-based biodiversity metrics across multiple spatial scales. Ecological Indicators, Biodiversity Monitoring 33, 139–147. doi:10.1016/j.ecolind.2012.11.005
Sources/Usage
Public Domain.