
How to identify fog pixels in satellite images

Detailed Description
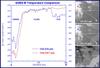
This graphic by aviation meteorologist Gary Ellrod explains how to identify which pixels in a nighttime satellite image are low stratus (fog), high cirrus (not fog) or clear sky. Three images of the same location at the same time are stacked in a column on the right with a transect line of 480 km from site A to site B. The top picture is from GOES sensor channels 4, sensitive to longwave 10.7 μm infrared energy, and the middle picture is from sensor channel 2 ,sensitive to shortwave 3.9 μm infrared. The bottom image is the result of subtracting the radiant energy value of channel 2 from channel 4. The darkest pixels are high cirrus, the lightest are low stratus fog, and clear sky is a grey shade. The graph on the left shows the radiant energy converted to temperature degrees Kelvin, for each pixel along the transect. At night, when there is no reflected solar radiation to overwhelm the infrared sensors, temperatures from both the shortwave and longwave infrared channels are much lower for pixels with high cirrus cloud cover (0 – 50 km) and higher for pixels with no cloud or fog cover. Using these relationships, algorithms have been developed to automatically identify fog pixels: first the threshold to differentiate “cirrus” from “clear” or “fog” is identified, and then the threshold to differentiate “clear” from “fog” is identified.
Sources/Usage
Public Domain.
