
Image of area around flow front
Detailed Description
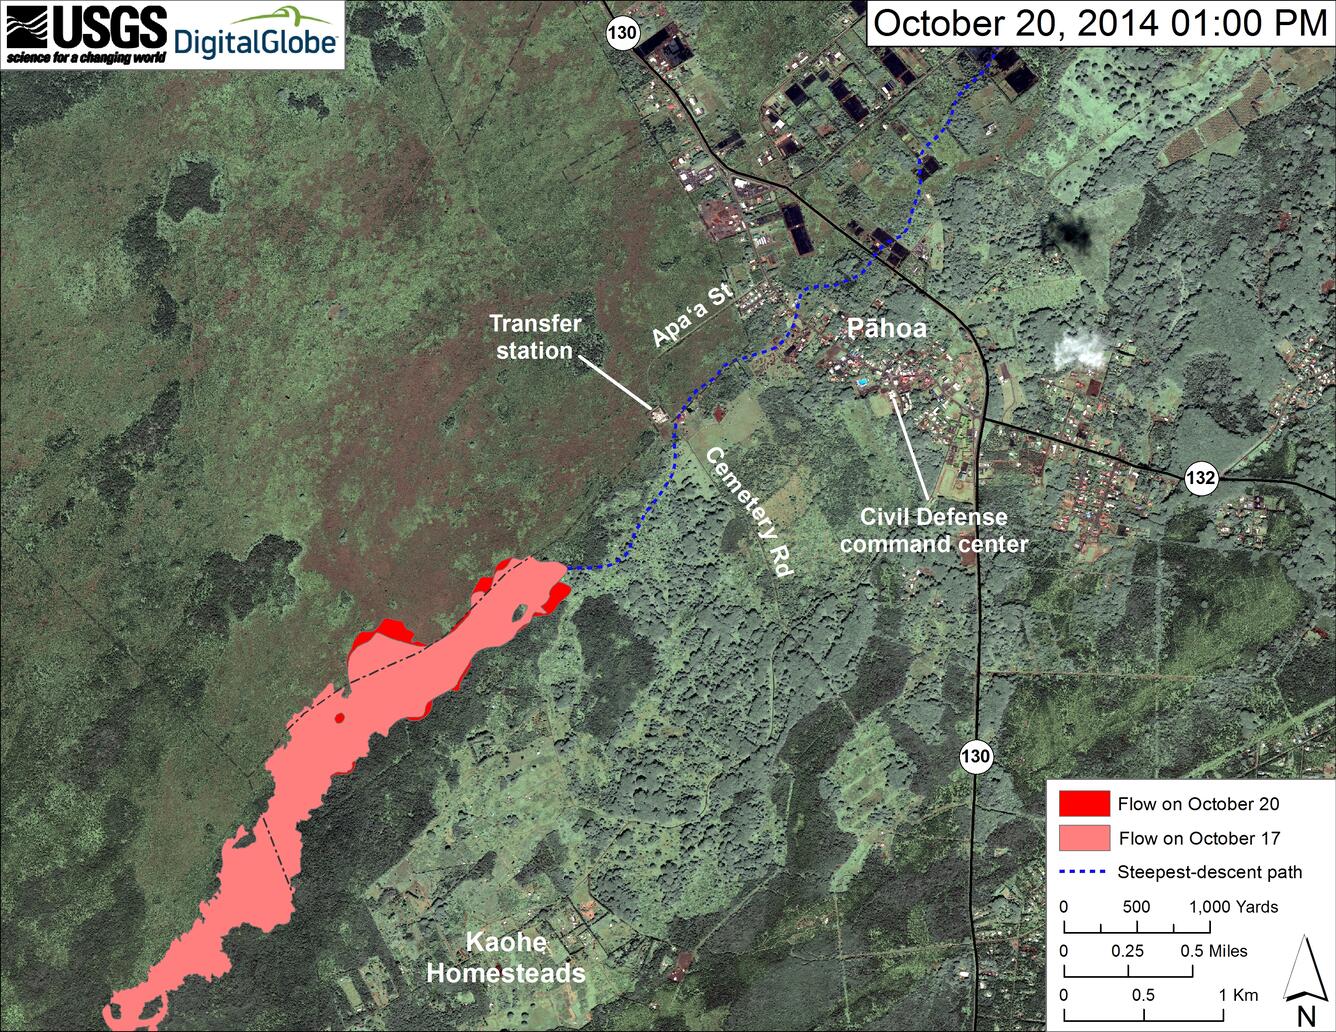
This map uses a satellite image acquired in March 2014 (provided by Digital Globe) as a base to show the area around the front of the June 27th lava flow. The area of the flow on October 17, 2014, at 7:40 AM is shown in pink, while widening and advancement of the flow as mapped on October 20 at 1:00 PM is shown in red. The flow front did not advance and was still about 1.1 km (0.7 mi) upslope from the closest point along AP‘A‘ā Street (Cemetery Road), as measured in a straight line, and about 1.3 km (0.8 mi) upslope measured along the path of steepest-descent that the flow has been following.
A narrow finger has been advancing about 80 m (90 yd) per day along the southeast edge of the flow, near the front, for the past week. At that rate, the finger of lava should overtake the front in the next day or two. It will likely follow the same steepest-descent path that the flow has been following. Other breakouts upslope from the flow front have caused additional widening the flow. The flow is about 670 m (730 yd - more than 7 football fields end to end) across about 1.3 km (0.8 mi) back from the front.
The dotted blue line shows the steepest-descent path, calculated from a 1983 digital elevation model (DEM; for calculation details, see http://pubs.usgs.gov/of/2007/1264/), that the flow is projected to follow. Steepest-descent path analysis is based on the assumption that the DEM perfectly represents the earth's surface. DEMs, however, are not perfect, so the dotted blue line can be used to infer only an approximate flow path.