
July 2022 Streamflow
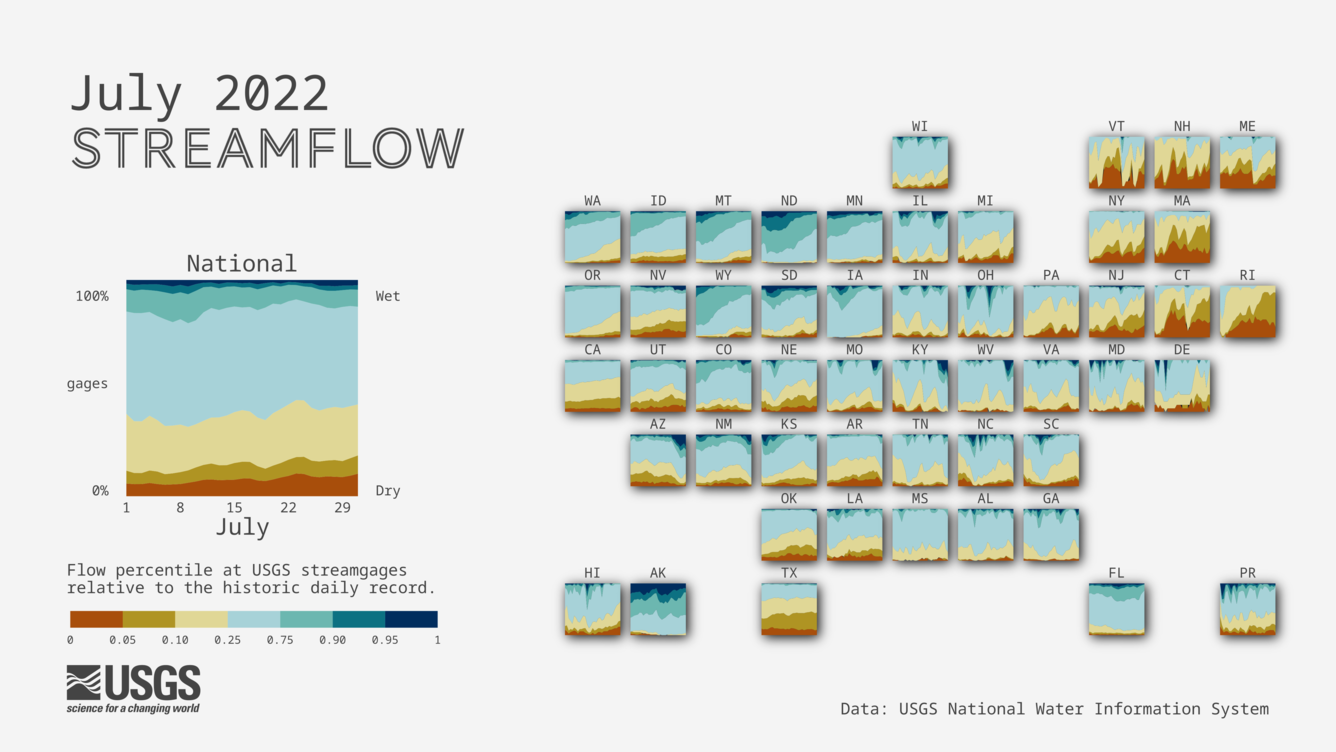
Detailed Description
A cartogram map of the US with proportional area charts for each state showing the proportion of streamgages by flow levels, categorized using percentile bins. Streamflow level percentiles are calculated using the historic daily record for each gage, and binned to reflect whether flow conditions are wetter or drier than the historical record. For the month of July, the Northeast states faced dry conditions while much of the Northwest was in normal to wet conditions compared to the historic daily record.
View the previous month's streamflow conditions: June 2022 Streamflow | U.S. Geological Survey (usgs.gov)
Sources/Usage
Public Domain.