
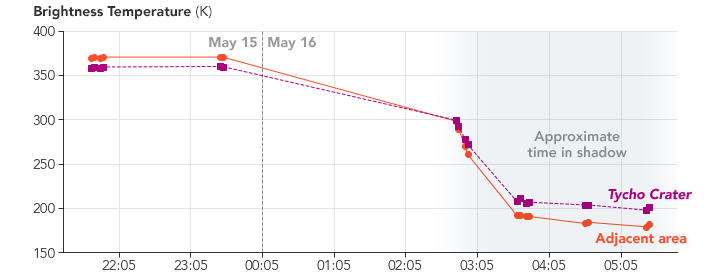
Brightness Temperature v. Time chart for TIRS

Detailed Description
Over the course of the four-hour eclipse, the TIRS sensors observed the intensity of infrared light radiating from the Moon’s surface. From those radiances, scientists calculated the temperatures required to generate them. This “brightness temperature” of the lunar surface changed as Earth’s shadow marched across the lunar landscape. Brighter areas in the images are warmer than darker, cooler areas.
Sources/Usage
Public Domain.