
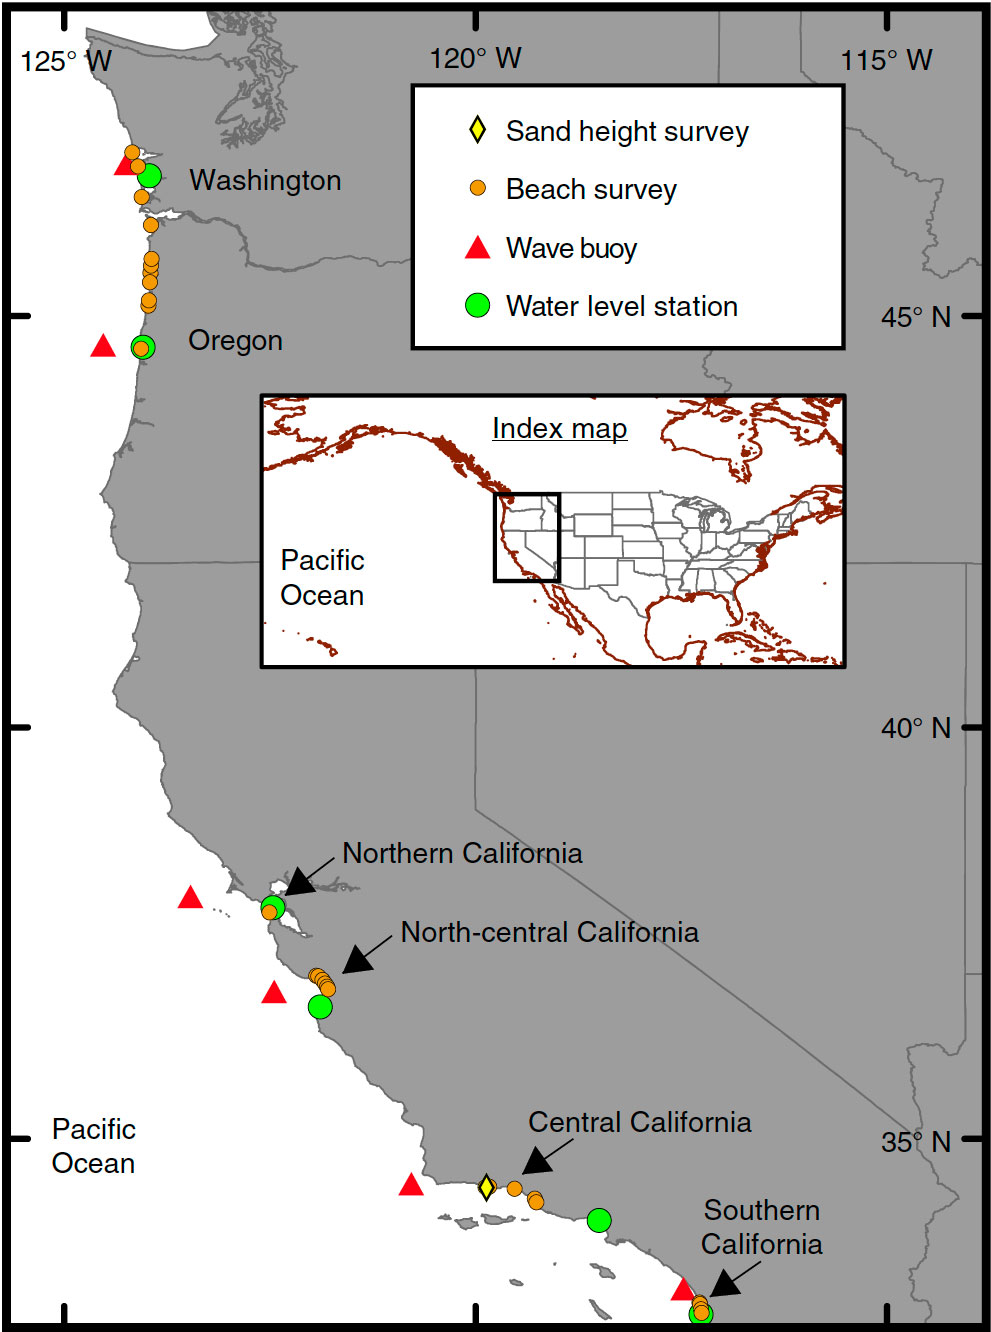
Map showing the six USGS study regions
By Coastal and Marine Hazards and Resources Program
2017 (approx.)

Detailed Description
Map showing the six regions where USGS researchers and collaborators collected and analyzed wave, water-level, and beach-survey data. Published in Nature Communications paper: CC BY 4.0 by https://www.nature.com/articles/ncomms14365.
Sources/Usage
CC BY 4.0 by https://www.nature.com/articles/ncomms14365