
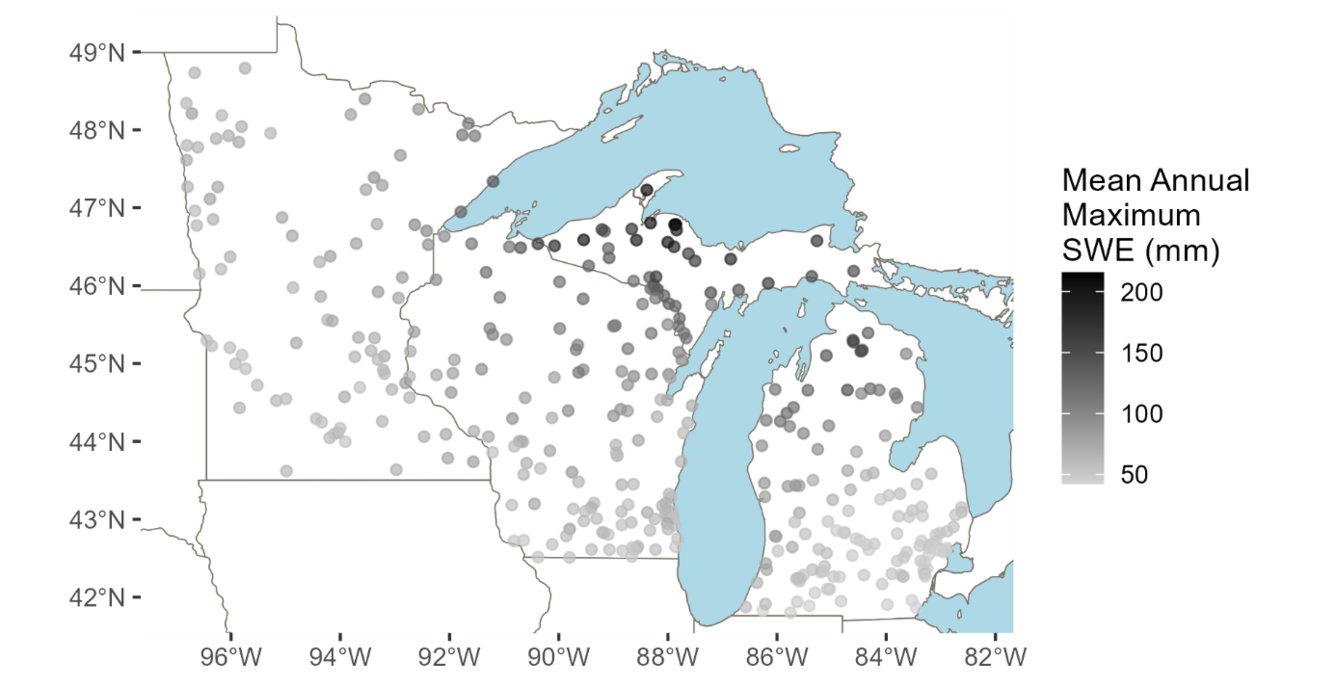
Map of streamgages in the GAGES2 dataset with greater than 10 years of discharge data and snow water equivalent
By Upper Midwest Water Science Center
2011 (approx.)
Detailed Description
Map of gages in the GAGES2 dataset with >10 years of discharge data (see Falcone, 2011). Dots are colored by the mean annual maximum Snow Water Equivalent (SWE) for the watershed draining to the gage. There is a general spatial pattern in snowpack across these watersheds, where mean annual maximum SWE is highest in northern regions and lowest in southern regions.
Data source: Falcone, J. A. (2011). GAGES-II: Geospatial attributes of gages for evaluating streamflow. US Geological Survey.
Sources/Usage
Public Domain.