
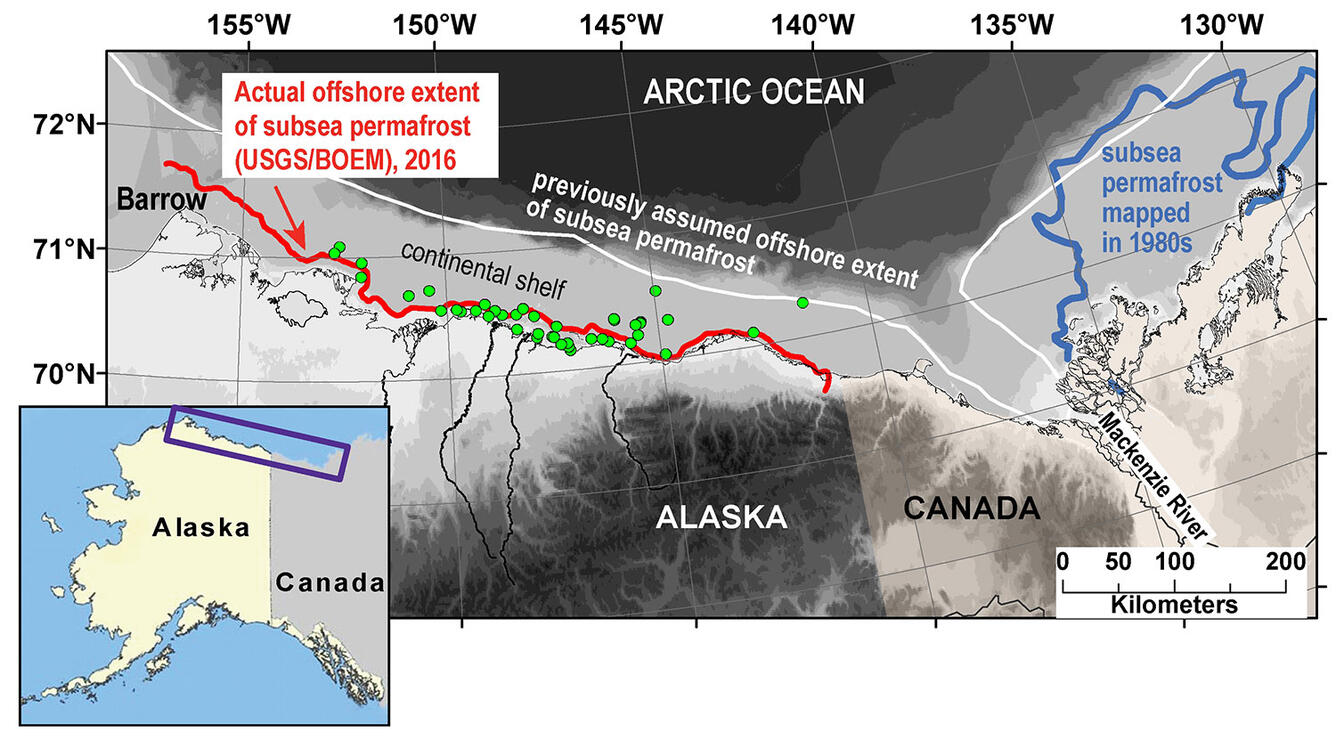
Map of subsea permafrost distributions on the Arctic Ocean margin
By Coastal and Marine Hazards and Resources Program
2017 (approx.)
Detailed Description
Map of subsea permafrost distributions on the U.S. and Canadian Arctic Ocean margin. The inset map shows the location of the larger map. Subsea permafrost on the Canadian margin was delineated in the 1980s (blue curve). The red curve on the U.S. margin was determined using over 62,000 miles (100,000 line kilometers) of industry seismic reflection data and marks the seaward extent of subsea permafrost that can be readily detected with seismic methods. The green circles denote boreholes that have geophysical data useful for constraining the occurrence of subsea permafrost or relict gas hydrate. The white curve marks the seaward extent of subsea permafrost as assumed since the 1990s. Image credit: USGS.
Sources/Usage
Public Domain.