
Maximum and Minimum Inundation for the Confluence of the Sacramento and San Joaquin Rivers
By Western Geographic Science Center
February 2022 (approx.)

Detailed Description
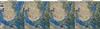
The confluence of the Sacramento River and San Joaquin River (CA) undergoes considerable intra-annual changes in surface water inundation. The example illustrates the difference between maximum 2017 inundation (January-March) to lower levels of inundation towards the end of the calendar year. High-confidence water pixels are shown in blue with a 2018 USDA NAIP base image.
Sources/Usage
Public Domain.