
Tracklines along which R/V Ocean Starr (2017, red lines) and R/V Norseman (2016, black lines) conducted seismic-reflection surveys, overlaid on high-resolution bathymetry (color background). Yellow stars represent earthquakes of magnitude (M) 7 and greater since 1900.
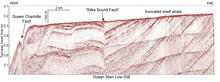
Multichannel seismic-reflection profile, Sitka Sound
By Pacific Coastal and Marine Science Center
July 2017 (approx.)

Detailed Description
Multichannel seismic-reflection profile showing deformed and offset sediment layers below the outer continental shelf west of Sitka. The Sitka Sound fault is one of more than a dozen previously unmapped faults discovered in the July 2017 seismic-reflection data. Location of profile shown by northern-most yellow line on trackline map, near Sitka. km, kilometer; m, meter; s, second.
Sources/Usage
Public Domain.
Related Content

Research vessel tracklines offshore of southeast Alaska
Tracklines along which R/V Ocean Starr (2017, red lines) and R/V Norseman (2016, black lines) conducted seismic-reflection surveys, overlaid on high-resolution bathymetry (color background). Yellow stars represent earthquakes of magnitude (M) 7 and greater since 1900.

Multichannel seismic-reflection profile, QCF fault
Multichannel seismic-reflection profile showing deformed sediment layers on the Pacific plate, just seaward of the Queen Charlotte-Fairweather fault near the south end of the study area. Location of profile shown by southern-most yellow line on trackline map, near Noyes Cyn. (Canyon).
Multichannel seismic-reflection profile showing deformed sediment layers on the Pacific plate, just seaward of the Queen Charlotte-Fairweather fault near the south end of the study area. Location of profile shown by southern-most yellow line on trackline map, near Noyes Cyn. (Canyon).

Yakobi Sea Valley
Enlarged map of the Yakobi Sea Valley. Closeup view (upper right) shows right-lateral offset of the Yakobi Sea Valley wall by the Queen Charlotte-Fairweather fault. MCS, multichannel seismic; km, kilometers. For location, see the southeastern Alaska trackline map.
Enlarged map of the Yakobi Sea Valley. Closeup view (upper right) shows right-lateral offset of the Yakobi Sea Valley wall by the Queen Charlotte-Fairweather fault. MCS, multichannel seismic; km, kilometers. For location, see the southeastern Alaska trackline map.
Related Content
Research vessel tracklines offshore of southeast Alaska
Tracklines along which R/V Ocean Starr (2017, red lines) and R/V Norseman (2016, black lines) conducted seismic-reflection surveys, overlaid on high-resolution bathymetry (color background). Yellow stars represent earthquakes of magnitude (M) 7 and greater since 1900.
Tracklines along which R/V Ocean Starr (2017, red lines) and R/V Norseman (2016, black lines) conducted seismic-reflection surveys, overlaid on high-resolution bathymetry (color background). Yellow stars represent earthquakes of magnitude (M) 7 and greater since 1900.
Multichannel seismic-reflection profile, QCF fault
Multichannel seismic-reflection profile showing deformed sediment layers on the Pacific plate, just seaward of the Queen Charlotte-Fairweather fault near the south end of the study area. Location of profile shown by southern-most yellow line on trackline map, near Noyes Cyn. (Canyon).
Multichannel seismic-reflection profile showing deformed sediment layers on the Pacific plate, just seaward of the Queen Charlotte-Fairweather fault near the south end of the study area. Location of profile shown by southern-most yellow line on trackline map, near Noyes Cyn. (Canyon).
Yakobi Sea Valley
Enlarged map of the Yakobi Sea Valley. Closeup view (upper right) shows right-lateral offset of the Yakobi Sea Valley wall by the Queen Charlotte-Fairweather fault. MCS, multichannel seismic; km, kilometers. For location, see the southeastern Alaska trackline map.
Enlarged map of the Yakobi Sea Valley. Closeup view (upper right) shows right-lateral offset of the Yakobi Sea Valley wall by the Queen Charlotte-Fairweather fault. MCS, multichannel seismic; km, kilometers. For location, see the southeastern Alaska trackline map.