
Nearshore tsunami amplitudes
Detailed Description
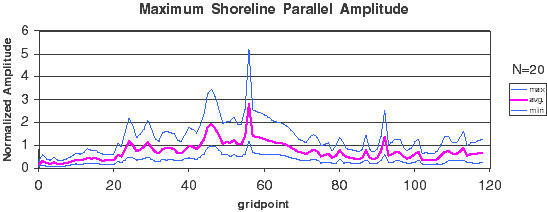
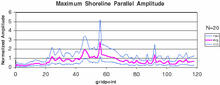
To determine the range of possible tsunami amplitudes for a given earthquake magnitude and location, a Monte Carlo-type simulation can be run, involving a large number of slip distributions. Statistics from the simulation could then be used for hazard planning. An example showing minimum, average, and maximum nearshore tsunami amplitude (not runup) for a section of the Pacific Northwest coastline is shown below. The horizontal gridpoint axis is distance measured parallel to the shoreline (approx. 3.5 km/gridpoint).
Sources/Usage
Public Domain.