
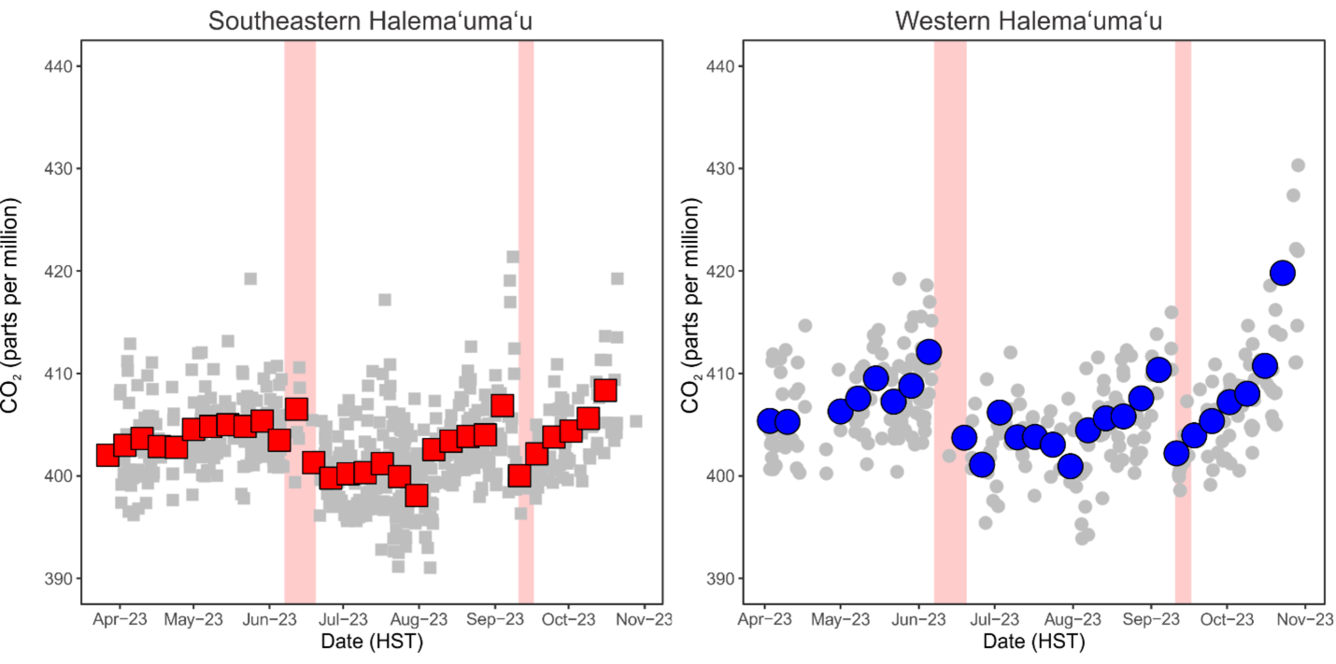
Plots showing provisional CO2 concentrations from two approximate areas at Kīlauea summit, March–October 2023
Detailed Description
These plots show provisional CO2 concentrations from two approximate areas at Kīlauea summit, over March–October 2023. Final, quality-assured concentrations will be calculated during post-processing by making small adjustments to the provisional data using measurements of known calibration gases, but the relative trends shown here are real (and are the sum of volcanic signals and variations in background CO2). Red squares and blue circles represent weekly averages of CO2 concentration measured at the Kīlauea multi-GAS station when the wind is coming from specific directions at specific wind speeds. Gray symbols are the individual measurements (30-minute averages up to 8 times per day). Pink vertical bars represent the June and September Kīlauea eruptions.
Sources/Usage
Public Domain.