
Simulated Land Cover Scenarios
By Climate Research and Development Program
October 2020 (approx.)
Detailed Description
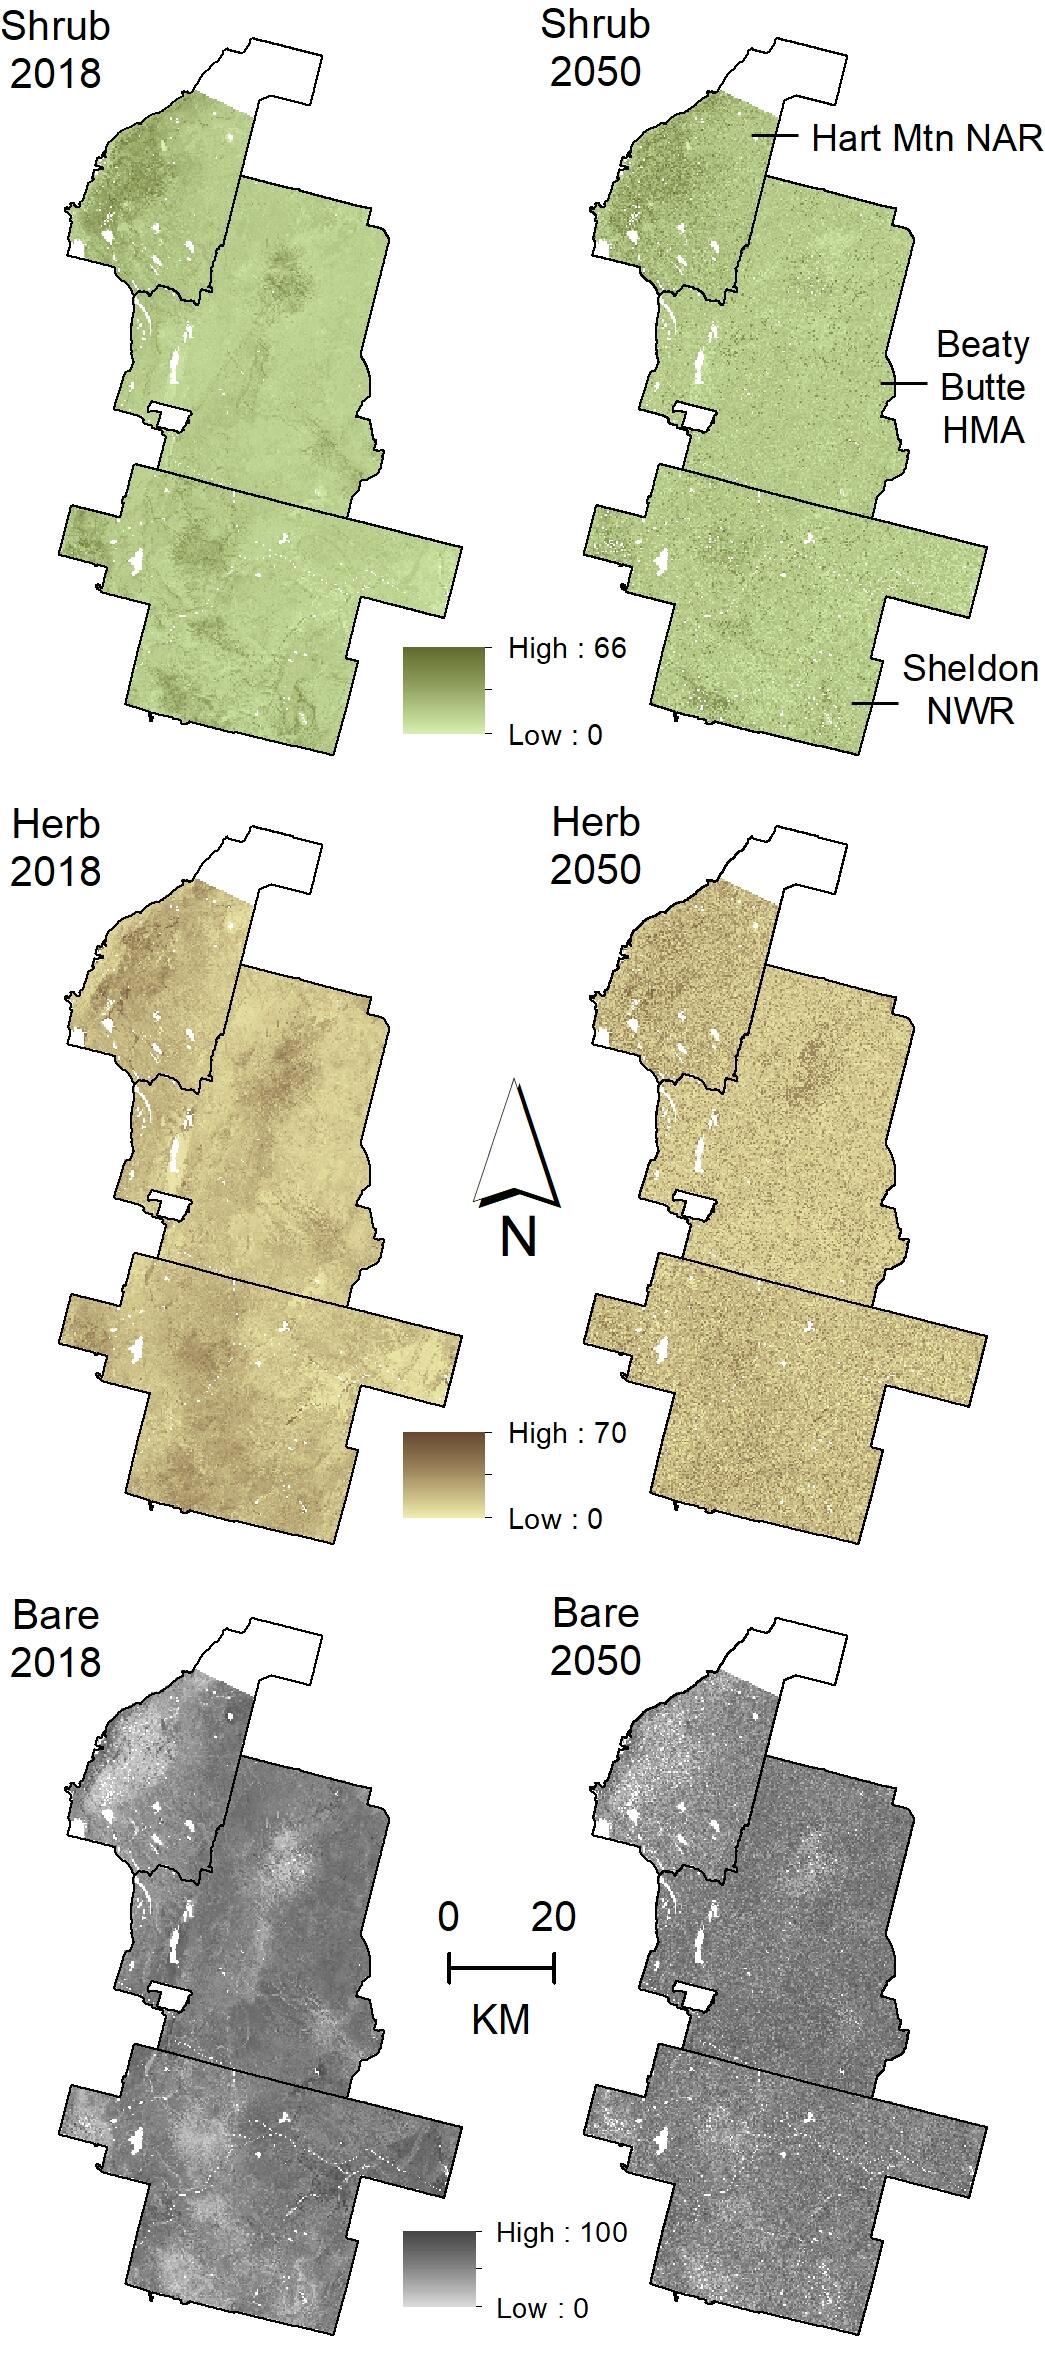
Figure 2. There are 60 simulated maps representing the possible composition of each land cover type by the year 2050 between the BAU and RCP 8.5 scenarios. Below we show the 2018 land cover composition for shrub, herbaceous, and bare ground cover along with an example representing a possible distribution of each cover type by 2050 based on a single RCP 8.5 simulation. Different simulations will have different distributions and concentrations of land cover by 2050, but no single simulation is more or less likely than another.
Sources/Usage
Public Domain.