
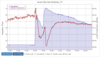
Time-series data for the USGS station at Jacobs Well near Wimberley

Detailed Description
In this example, time-series data for the USGS station at Jacobs Well near Wimberley, TX (https://waterdata.usgs.gov/nwis/uv?site_no=08170990) is shown from January 9 through 29, 2017. The GWIS plot shows both streamflow and specific conductance in the graph. Double y-axes are used showing how specific conductance changes as streamflow increases.