
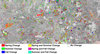
USGS LCMAP data overlay on east-central North Dakota wetlands
By Land Change Monitoring, Assessment, and Projection
2019 (approx.)

Detailed Description
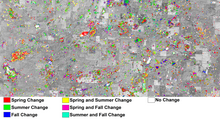
The USGS Land Cover Monitoring, Assessment, and Projection (LCMAP) version 1 Time of Spectral Change product shows when changes occur in wetlands. In this example from east-central North Dakota, red indicates a springtime change, green indicates a summer change, and blue represents a change in the fall. When changes occurred in more than one season, the color represents a mixture of those colors. Pink areas had spring and fall change (red and blue=pink), whereas yellow represents spring and summer change (red and blue=yellow), and areas with cyan changed in the summer and fall (green and blue=cyan). White areas did not have any change from 1985 to 2017.
Sources/Usage
Public Domain.