
USGS National Water Dashboard Example - Zeta

Detailed Description
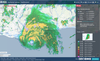
This image shows Hurricane Zeta’s landfall on the Gulf coast on 10/28/2020. Flow conditions can be explored by clicking on the option in the Layers menu, along with other dataset choices such as weather radar and GOES satellite data. Blue circles show where streamgage water levels are rising, while while orange/red dots show sites where levels are receding. Clicking on the legend button will bring up information about the symbols used in the map.
Sources/Usage
Public Domain.