
In the Field with Kate Scharer
What’s a day in the life of a research geologist like?
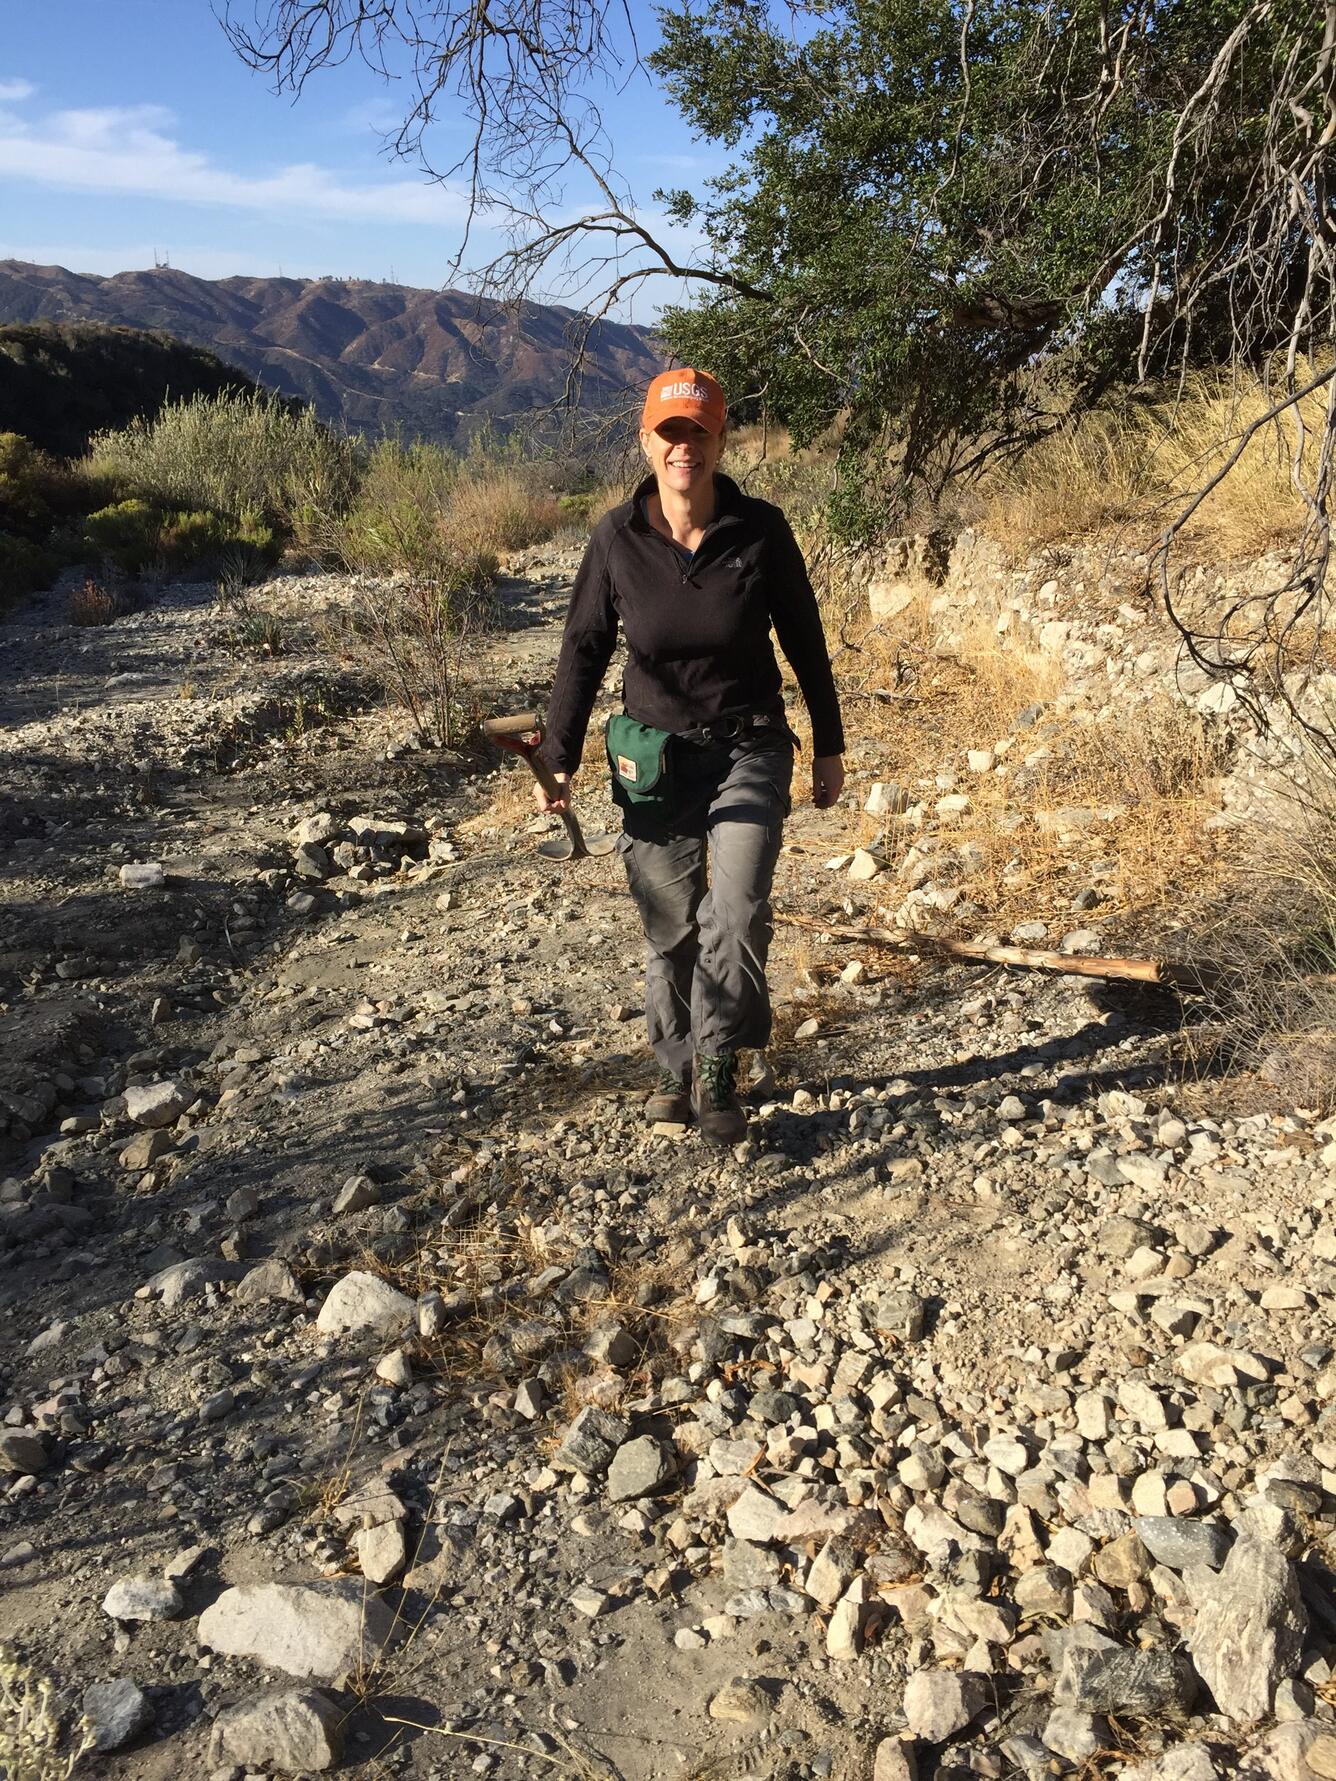
What’s a day in the life of a research geologist like? I asked Dr. Kate Scharer, who studies the timing and size of prehistoric earthquakes along the San Andreas Fault and other active faults in southern California, if I could tag along with her one day. To my surprise, a few days later I was in the field looking at seismic faults.
Scharers’s area of expertise is “paleoseismology,” the study of old earthquakes. Old as in hundreds to thousands of years old. She works to understand how often big quakes happen on faults and the geologic slip rate on active faults in southern California. To do this, she combines Quaternary geochronologic data with field mapping and Light Detection and Ranging (or LiDAR) analysis. Which means that she uses chemical techniques to determine the age of ancient landforms displaced by faulting and measures the amount of fault displacement by measuring offsets of surface features from photographs and precision topographic maps produced by laser scanners. More on that later.
We were on the road by 7:30 a.m. on a chilly autumn morning with strong Santa Ana winds. Scharer had already packed all her usual equipment: short shovel, field notebook, hammer, precision GPS devices, and a cell phone loaded with maps of the area--fault lines marked. Within the hour, Kate, with me in tow, was out in the field doing reconnaissance work at Deukmejian Wilderness Park on the Sierra Madre Fault.
The purpose of Scharer’s field work is to learn more about geologic faults in California in order to identify which faults present the largest earthquake hazards. This fault activity data populates the National Seismic Hazards Map, helping make people and infrastructure safer. Her work is ultimately used by engineers and others who design the region’s major infrastructure—roads, bridges, buildings—which must be built to last 50, 100, or even 150 years.
When I asked how she selects her field locations, she said that because of the immense urban development in southern California, historic photographs are very important. She also uses topographic maps from the 1920’s, old aerial photographs and now, LiDAR – which is used to make high-precision topographic maps today – to help her hone in on sampling sites. Those tools alone, however, are not enough to pick the exact locations, and she described a lot of hiking and sometime scrambling up and down hillsides to find the right sites to collect samples.

She used terms that in everyday language mean one thing, but for a geologist they mean very particular things, like terraces, faults, and slip rate. I learned more about those as we worked our way along the fault.
Scharer pointed out terraces, landforms that in this area are 12,000- to 70,000-year-old stream beds -- and explained that these stream beds have been lifted up as the mountains are building up due to the repetition of large earthquakes. A fault is a fracture or zone of fractures between two tectonic blocks. Faults allow the blocks to move relative to each other. This movement may occur rapidly, in the form of an earthquake, or may occur slowly, in the form of creep. The speed at which the fault moves is called the slip rate, a measure of how fast the two sides of a fault are slipping relative to one another.
After selecting her first sampling spot, which also included looking at the form or shape of the land and the color and texture of the soil forming on the terrace, Scharer used a soil knife to collect samples of sand and gravel for later examination. She repeated the sample collection process at multiple sites, so that she can determine the age of many terrace levels to figure out the sequence of events that led to the modern landscape.
I asked what she did with the rocks and soil she collects. It turns out sample analysis is high-tech, using techniques such as surface exposure dating, luminescence dating, or radiocarbon dating. The technique she uses depends on the type of material and its environment. Surface exposure dating, for example, tells the researcher how long a deposit has been sitting on the landscape, as it measures the accumulation of rare isotopes in the upper 6.5 feet of soil through its bombardment by cosmic rays. Luminescence dating, in contrast, is done on sandy deposits and identifies the last time the sand grain was exposed to light, giving an indication of its age and how long it has been there. Radiocarbon dating is used on organic material such as tree bark or charcoal that can be found in gravel deposits.

A geologic slip rate is measured like velocity, as in distance divided by amount of time (such as miles per hour). Tectonic blocks, though, move much more slowly; typically less than an inch per year. To figure this out, Scharer determines the distance a landform like a terrace has been displaced by a fault, and then divides that by the age of the landform. Scharer then compares this slip rate, the average speed of a fault’s movement, with other faults to discern which faults are moving the fastest, and thus are more likely to experience a large earthquake, and which faults are moving very slowly, and are less likely to have a large earthquake. These data help decision makers prioritize mitigation projects and to answer the important question: How many shaking events might a bridge or road built on or along a fault experience over its lifetime? That infrastructure needs to be built to withstand all the shaking a particular structure could experience from all of the faults nearby and be readily repaired to be functional after an earthquake. There are more than 30 active faults in the Los Angeles area, and the slip rate data help prioritize which faults are more hazardous.
When I asked why she does this work, which she obviously loves, Scharer explains that, “The Sierra Madre Fault Zone is one of the larger faults in southern California. It hosted a moderate earthquake in 1971 – the M6.6 San Fernando Earthquake – and I want to understand if that is typical, or if the fault also hosts much larger earthquakes, as big as M7.9. The fault is quite long and thus capable of producing a much larger earthquake. The goal of this work is to understand the rate at which the fault accumulates tectonic motion, and that information is combined with the time since the last major earthquake occurred on it (from paleoseismology), to estimate how much slip may occur in the next earthquake.”

As Scharer collected the last sample, I asked her what she finds satisfying about this work, why earthquake geology? She told me, “In southern California, if you are standing on a hill, you are very likely standing above a major fault.”
She went on to explain that “because major earthquakes occur on these faults, geologists are needed to untangle the pace of deformation and the potential size and effects of the earthquakes. This work allows me to apply my interest in the evolution of the landscape through geologic time to a problem that is useful for society.”
As the field day ended and Scharer and I gathered equipment and the samples to take back for analysis, I asked what she enjoyed most about the work. She quickly answered: “Working with a great team that is constantly changing. All of my projects involve a group of scientists that is a mix of university professors and students, plus professionals from private consulting firms, state agencies and regional utilities.”
Each study, she noted, requires a different set of skills as each fault is a bit different in the style of deformation and the methods the team uses to date past activity. “Working with different groups over time allows me to meet and collaborate with other wonderful geologists and to help understand the complexity of the earth.”
And so ended a day in the field with research geologist Kate Scharer.
