
Improving avalanche hazard forecasting in a variable climate in mountain ecosystems
This article is part of the Spring 2017 issue of the Earth Science Matters Newsletter.
Glacier National Park includes 1,583 square miles of picturesque glacier-carved peaks and valleys in northwest Montana (Figure 1), and its glaciers, scenery, and hiking opportunities make it one of the top ten national parks visited each year. The Going-to-the-Sun Road, constructed in the early 20th century, links the eastern and western entrances of the park, and reaches its highest point (6,646 feet) at Logan Pass, where it crosses the Continental Divide.

The Sun Road, as it sometimes is called, is one of the Park’s most popular tourist attractions and is the only road that traverses the entire width of the Park (Figure 2). The alpine section of the road climbs through cliffs midway from valley bottom to the crest of the Continental Divide. Vehicles traversing the road are separated from potential drops of thousands of feet by low retaining walls and barricades. The road closes every fall due to severe weather and heavy snowfall, with up to 80 feet of snow accumulating on the eastern side of Logan Pass at “The Big Drift”. In the spring, clearing the road of snow requires ten weeks of plowing effort using heavy machinery. It is hazardous duty on the two-lane road, and avalanches from the slopes above can both delay opening of the road and present significant safety hazards to road crews and the public (Figure 3). In 1953, two plow operators were buried and killed in an avalanche. Heavy equipment used for snow removal has been pushed off the road by avalanches on more than one occasion.

Accurate avalanche forecasting is imperative for the safety of the snow removal operations and later use of the road by tourists, and it also has large economic impacts. Nearly three million tourists and snow enthusiasts visit Glacier National Park each year to enjoy the park’s natural attractions. A joint study between the U.S. Geological Survey and National Park Service in 2015 reported $199 million spent each year by tourists in communities near Glacier Park. Delays in opening the Sun Road due to avalanche safety concerns can cost local communities dearly.


USGS scientists from the Northern Rocky Mountain Science Center have been studying snowpack stability and shifts in snow melt, runoff, and mountain stream timing in collaboration with the National Park Service for the last 26 years. They expanded this work to provide information on the causes and frequency of snow avalanches, with a particular focus on wet snow avalanches which occur in the spring when snow melt weakens the strength of the snowpack. This is especially germane for the future since wet snow avalanches are likely to become more common with ongoing climate change.
Beginning in 2002, USGS began collecting data along the Going-to-the-Sun Road during spring snow removal operations to analyze and model the physical triggers for avalanche release, including snow structure and weather factors. This is a unique situation for studying natural releases of avalanches because explosives are not used to mitigate avalanche hazard as they generally are at ski resorts or other highway corridor operations. The research has two purposes: to provide real time data and avalanche hazard forecasting needed by park managers to evaluate safety and logistical impacts of avalanches, and to generate data needed to better understand the role of avalanches in mountain ecosystems.
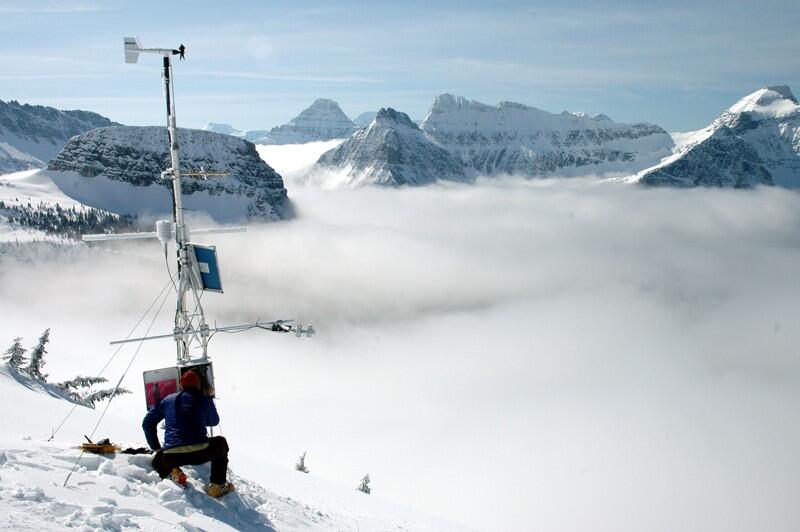
The unique 15-year dataset is comprised of near-daily observations of avalanche occurrence and their size, type, location and destructive magnitude. Snow structure was examined in hundreds of snowpits for snow grain size and temperature gradients, both relevant characteristics for snowpack strength (Figure 4). The dataset also relies on a network of alpine climate stations established by the USGS to study snowpack accumulation history, density, stability, and timing of snow melt. These stations have been strategically placed adjacent to avalanche starting zones to better understand factors such as wind loading (Figure 5). They augment Snow Telemetry (SNOTEL) stations and National Weather Service stations in the region. Additional instruments have been added to the USGS stations for avalanche research that detect the onset of snowmelt and are directly incorporated into an avalanche-hazard forecasting program.
Prior to the installation of this network of USGS weather stations, forecasts of avalanche hazards and extreme weather conditions were based on general observations of increasing wet snow conditions. According to Marty Whitmore, Warning Coordination Meteorologist from the National Weather Service (NWS), data provided by the USGS and other agencies greatly improved the accuracy of their weather forecasting. Real-time and near real-time data allow the NWS to verify and ground-truth forecasting of wind, temperature, and precipitation. The data provide point and spot forecasting support for local operations, especially during the 10-12 week period when the data from these stations are critical during snow plowing in preparation of the opening of Going-to-the-Sun Road. Accurate weather forecasting by the NWS improves public and property safety, avalanche safety, and the safety of the crew clearing the road.

USGS avalanche researchers and their collaborators have improved forecasting by developing a detailed GIS-based avalanche atlas that describes the physical and geographic characteristics of all the avalanches that threaten the Going-to-the-Sun Road. They used statistical models (such as classification tree analyses) to identify the meteorological conditions immediately leading up to large, natural wet snow avalanche releases. They studied tree-ring chronologies of trees damaged in avalanche paths to understand how frequently large destructive avalanches occur in established avalanche paths.
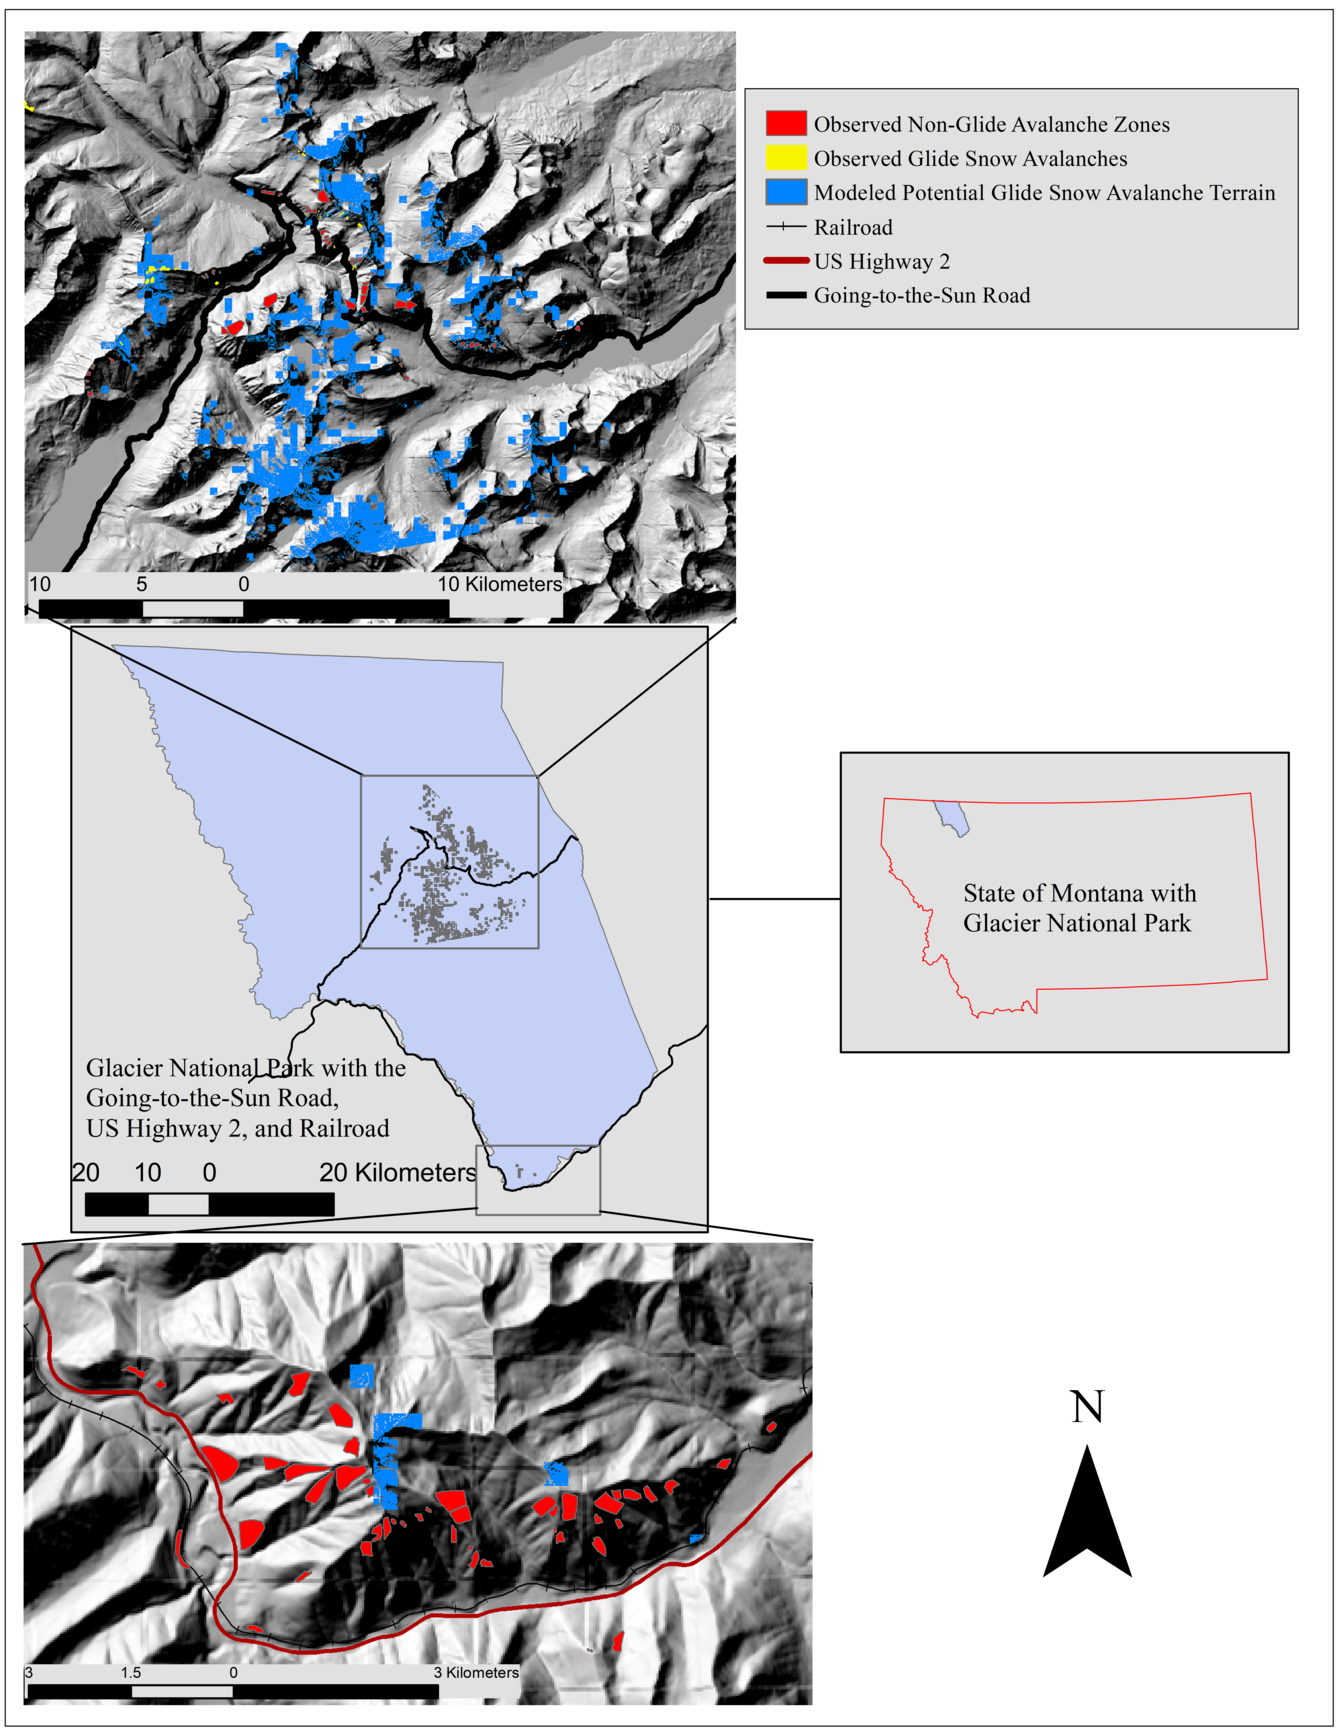
In recent research, their focus has been on glide snow avalanches, a specific form of wet snow avalanche that develops when meltwater in the spring percolates to the bottom of the snowpack and glides on the wet rock or vegetation underneath. As the snowpack glides, it creates a tear, or crack, on the surface of the snow. These glide avalanches are a special threat to the Going-to-the-Sun Road in the spring. A variety of methods used to study the onset and timing of glide cracks includes laser rangefinders (to safely measure their dimensions from a distance) and remote time-lapse cameras that record the hour during which they appear and, later, when they fail (Figure 6). USGS scientists have also classified all the terrain parameters of areas where glide cracks typically occur along the Sun Road and then used this spatial model to map all the other areas in the park where glide avalanches are likely to develop (Figure 7). All of these advances in avalanche knowledge are immediately incorporated into ongoing hazard forecasting because of the close working relationship of the NPS and USGS in Glacier National Park.
Most recently, USGS researchers are using relatively new remote sensing capabilities, such as LiDAR and Structure from Motion (SfM), in combination with traditional field sampling methods to assess avalanches as a safety hazard. The SfM utilizes multiple photographs to digitally create 3D surfaces (Figure 8). This provides a relatively inexpensive way to measure changes in snow depth and distribution over larger areas that will inform avalanche hazard evaluation. For glide avalanches, the USGS scientists have applied SfM to remotely measure the glide crack characteristics. Having such detailed data on timing, evolution, and size characteristics of major glide cracks, coupled with meteorological data, will advance our understanding of glide avalanche dynamics and the threats they pose.

In addition to avalanche dynamics, researchers are also studying avalanche and climate associations using both long-term observational records as well as tree-ring analysis (dendrochronology). When avalanches impact a live tree they leave a scar that is evident in the tree rings. Scientists extract cores from live trees or cut cross-sections from dead trees to develop an avalanche chronology (Figure 9). This allows them to examine avalanche frequency and magnitude in the context of weather and climate patterns. This is valuable for understanding how specific weather patterns influence large magnitude avalanche occurrence, and avalanche frequency and magnitude in a changing climate.

The partnership between USGS and the National Park Service has helped ensure the transfer of new knowledge directly to the managers responsible for decision-making. Glacier National Park instituted its first formal avalanche hazard forecasting program in 2002, focused mainly on snow removal operations. In addition to forecasting, the program provides real-time snow safety and weather data to equipment operators and has increased avalanche awareness through regular avalanche safety training. The data also are used by the National Weather Service, the USDA Forest Service, and others with crucial avalanche forecasting, rescue, fire, and predicting extreme weather and storms. This research provides value to these partners and the public as the variability of meteorological processes and frequency of extreme weather increases in a changing climate.
<< Back to Spring 2017 Newsletter
Get Our News
These items are in the RSS feed format (Really Simple Syndication) based on categories such as topics, locations, and more. You can install and RSS reader browser extension, software, or use a third-party service to receive immediate news updates depending on the feed that you have added. If you click the feed links below, they may look strange because they are simply XML code. An RSS reader can easily read this code and push out a notification to you when something new is posted to our site.