U.S. flag

An official website of the United States government

Elevation-Derived Hydrography Data Acquisition Specifications: Figures

Elevation-Derived Hydrography Data Acquisition Specifications

Selected Figures from Elevation-Derived Hydrography Data Acquisition Specifications Report - Techniques and Methods 11–B11

Clicking on an image will open a larger version.

EDH Data Acquisition Specifications Report Figure 1
Elevation-Derived Hydrography Acquisition Specifications Report Figure 1: Hydrography collection within a defined project area based on political boundaries.
EDH Data Acquisition Specifications Report Figure 2
Elevation-Derived Hydrography Acquisition Specifications Report Figure 2: Hydrography collection from existing light detection and ranging source.
EDH Data Acquisition Specifications Report Figure 3
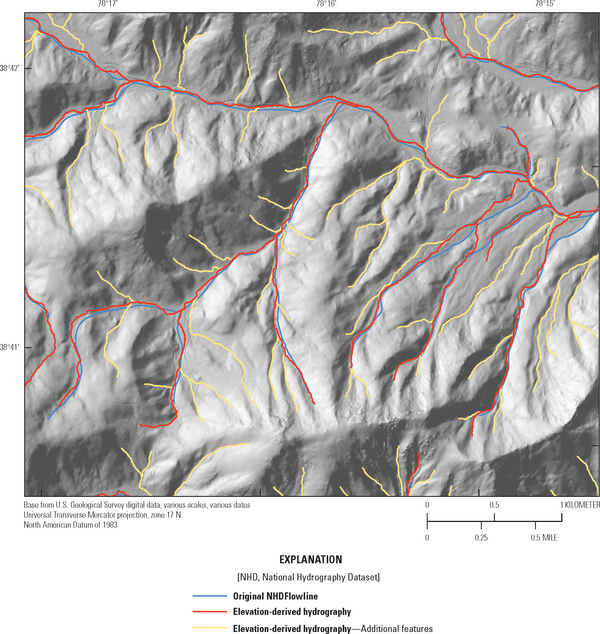
Elevation-Derived Hydrography Acquisition Specifications Report Figure 3: Minimum set of hydrographic features compared to the original National Hydrography Dataset.
EDH Data Acquisition Specifications Report Figure 4
Elevation-Derived Hydrography Acquisition Specifications Report Figure 4: Additional features with visible channels captured from the light detection and ranging-derived elevation surface.
EDH Data Acquisition Specifications Report Figure 5
Elevation-Derived Hydrography Acquisition Specifications Report Figure 5: Artifacts within National Hydrography Dataset density inherited from original quadrangle map delineation of hydrography.
EDH Data Acquisition Specifications Report Figure 6
Elevation-Derived Hydrography Acquisition Specifications Report Figure 6: The hydrography within the southern quadrangles of this 12-digit hydrologic unit must be densified to be consistent with the northern quadrangles.
EDH Data Acquisition Specifications Report Figure 7
Elevation-Derived Hydrography Acquisition Specifications Report Figure 7: The streams within the Roaring River watershed indicate density disparity because of the collection differences between Jackson, Overton, and Putnam Counties, Tennessee.
EDH Data Acquisition Specifications Report Figure 9
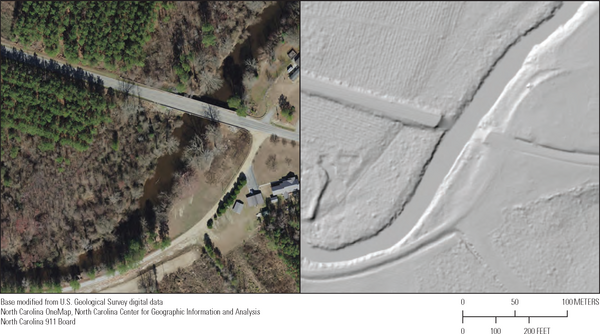
Elevation-Derived Hydrography Acquisition Specifications Report Figure 9: Bridge treatment in the bare-earth digital elevation model. The bridge deck is removed, and water surface is interpolated beneath the bridge to maintain a monotonic, continuous water feature.
EDH Data Acquisition Specifications Report Figure 10
Elevation-Derived Hydrography Acquisition Specifications Report Figure 10: An example of poor horizontal alignment. There are many instances in which the streams (in blue) fall outside the apparent channel of the elevation-derived surface.
EDH Data Acquisition Specifications Report Figure 17
Elevation-Derived Hydrography Acquisition Specifications Report Figure 17: Correcting headwater stream delineation at roads.
A overhead image of flat terrain with a drainageway feature flowing into a stream/river feature.
Elevation-Derived Hydrography Specifications Figure 11: Example map of Drainageway.
An overhead image of a flat area where an indefinite surface connector is used to connect two stream/river features.
Elevation-Derived Hydrography Specifications Figure 12: Example map of Indefinite Surface Connector.
An overhead image showing where terrain breach connectors are used to connect Stream/River features.
Elevation-Derived Hydrography Specifications Figure 13: Example map of Terrain Breach Connector.
Elevation-Derived Hydrography READ Rules: Canal/ditch Features Part of the Hydrographic Network
Elevation-Derived Hydrography Acquisition Specifications Report Figure 19: Canal/ditch features as part of a hydrologic network. [A denotes features in purple line color that should be included in the network. B denotes features in purple line color that should be removed from the network].
EDH Data Acquisition Specifications Report Figure 17
Elevation-Derived Hydrography Acquisition Specifications Report Figure 20: Two cross-sectional views of transects intersecting two stream/river segments. A. This stream/river segment has deviated horizontally from the main channel but is still vertically integrated with the elevation surface. B. This segment is well integrated vertically and horizontally with the lidar-derived surface. Both segments’ elevation values are within 0.1 meter of the elevation values of the surface.
EDH Data Acquisition Specifications Report Figure 18
Elevation-Derived Hydrography Acquisition Specifications Report Figure 21: An example of poor horizontal alignment. There are many instances in which the streams (in blue) fall outside the apparent channel of the elevation-derived surface.
Was this page helpful?