
The history and importance of airborne thermal infrared imaging in Yellowstone National Park
Airborne thermal infrared imaging is an important way to track hydrothermal activity in Yellowstone. The first such images were acquired in 1961.
Yellowstone Caldera Chronicles is a weekly column written by scientists and collaborators of the Yellowstone Volcano Observatory. This week's contribution is from R. Greg Vaughan, research scientist with the U.S. Geological Survey.

In 1800, German-British astronomer William Herschel discovered infrared light—electromagnetic radiation that exists beyond what we can see with our eyes. Using a prism to separate sunlight into its rainbow of colors, and placing a thermometer within distinct colors, Herschel noted that heating was unequal among the different colors, and that the temperature would increase further in a thermometer placed below the red color of the spectrum. Indeed, “infrared” means “below red,” although at the time Herschel called this part of the spectrum “invisible rays of the Sun” and “calorific rays.” He would also use the term, “radiant heat” and was the first to propose that visible light and radiant heat may be the same phenomenon. This was many decades before development of electromagnetic radiation theory.
In the century that followed, numerous advances were made in the ability to measure radiant heat, providing the ability to measure very small differences in temperature. For example, in 1901, a bolometer (a type of infrared detector invented in the 1870s by American astronomer and physicist Samuel Pierpont Langley), could detect thermal infrared radiation from a cow 400 m (1300 ft) away.
Thermal infrared imaging was born in 1929, when Hungarian physicist Kálmán Tihanyi invented an electronic television camera that was sensitive to thermal infrared light and could be used for military applications—it could see planes flying at night.
Thermal imaging methods advanced throughout the following decades, but much of the technology was classified because of its military applications. Eventually, thermal infrared cameras became more widely available, rendering thermal infrared radiation emitted by warm objects into an image represented by visible colors.
In April-May 1961, a series of aerial infrared images were collected in Yellowstone National Park by the U. S. Army Cold Regions Research and Engineering Laboratory and the Infrared Laboratory of the University of Michigan Institute of Science and Technology, in cooperation with the National Park Service. Several thermal areas were imaged, including Norris Geyser Basin, Roadside Springs, Roaring Mountain, Midway and Upper Geyser Basin, Tern Lake, Fern Lake, and Pelican Creek. Several other airborne infrared surveys were conducted in Yellowstone in the 1960s and 1970s. These data led to the discovery of some previously unknown thermal areas and allowed the creation of the first thermographic mosaic of Yellowstone National Park.
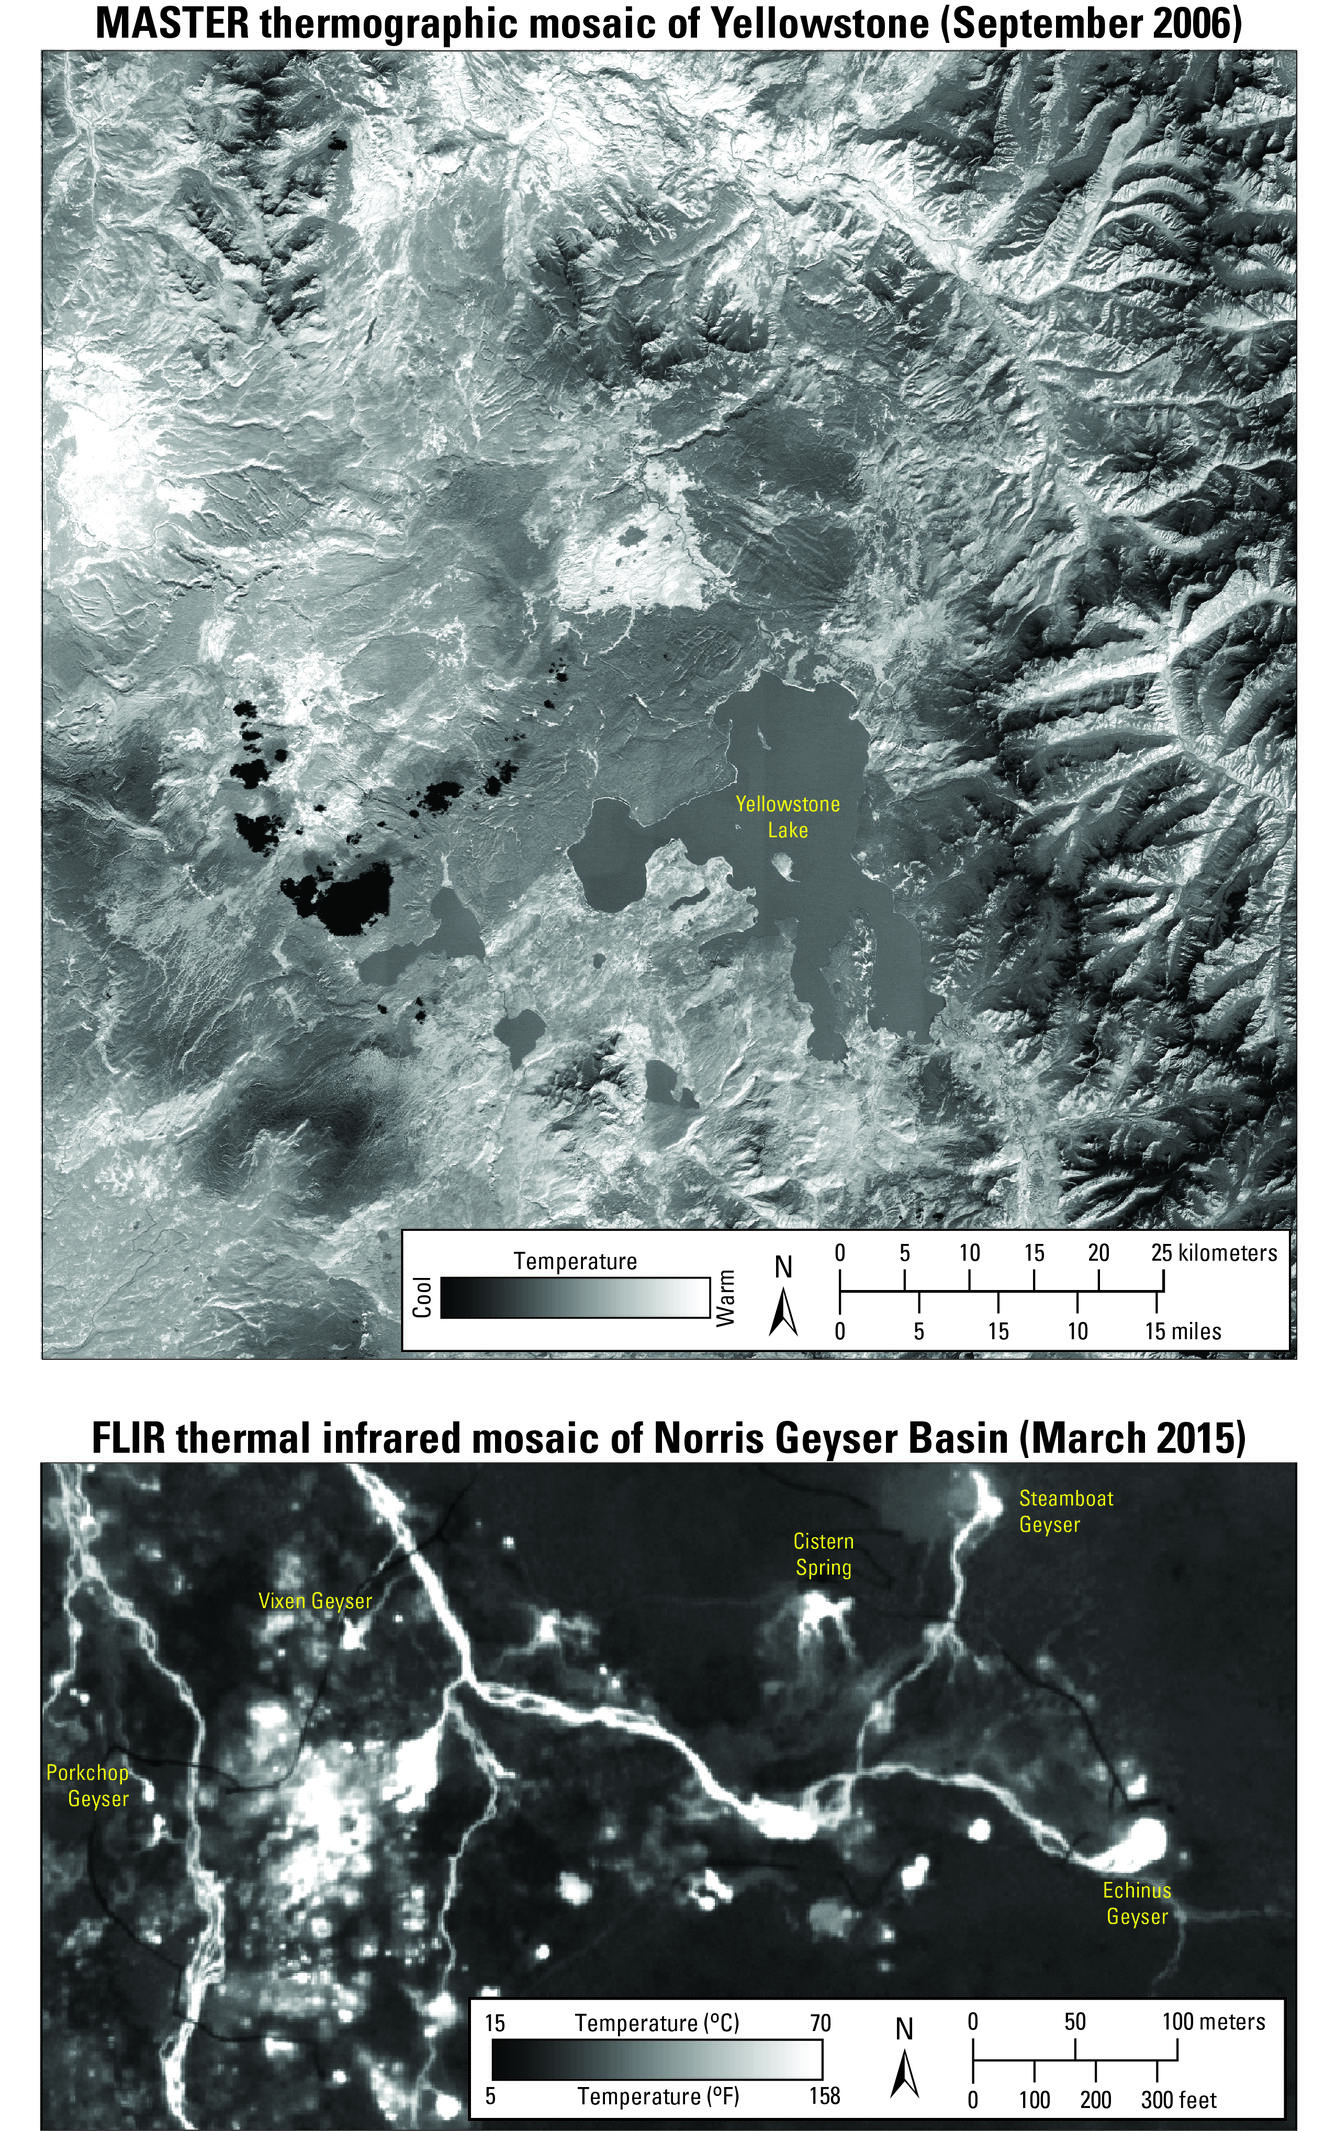
With modern infrared scanning and imaging technologies and digital image processing, it is now possible to produce seamless thermographic mosaics of large areas and high-resolution thermal infrared images of geyser and hot spring basins throughout Yellowstone. From 2005 to 2015, there was an annual (and sometimes bi-annual) campaign of airborne thermal infrared surveys of selected thermal areas in the park. These surveys produced very high-resolution (1 meter per pixel) mosaics, allowing for detailed mapping, characterization, and change detection of individual thermal features.
One of the tradeoffs with high-resolution airborne thermal surveys is that they are expensive and require a lot of logistical planning, and they are therefore infrequent. This is why YVO scientists make extensive use of satellite based thermal infrared imaging to study and monitor thermal activity in Yellowstone. These data have proven remarkably useful, for instance, in the discovery of a new thermal area near Tern Lake. And these data are complemented by high-resolution visible imagery that have also been used identify previously unmapped thermal areas.
While satellite data provide a wonderful overall view of thermal output from Yellowstone and some localized views of thermal features, airborne thermal infrared surveys are the most effective for detailed mapping and monitoring. YVO scientists are currently exploring new, more efficient, and cost-effective ways of acquiring high-resolution aerial thermal data, and we look forward to sharing our progress in future editions of Yellowstone Caldera Chronicles!