
Diagram shows the paths that the sound travels away from the sparker source (black oval). The ghost reflections are shown in green and orange. PP= Primary Pulse, BP = Bubble Pulse. From the study Practical approaches to maximizing the resolution of sparker seismic reflection data.
Multimedia
The Coastal and Marine Hazards and Resources Program shares a wide range of resources to help explain and illustrate scientific concepts, our scientific activities, expertise, technology, tools, and other educational resources. Through newsletters, multimedia resources, special events, and other products, you can learn more about the many ways our science supports the Nation.
Images

Diagram showing paths that sound travels away from the sparker source
Diagram shows the paths that the sound travels away from the sparker source (black oval). The ghost reflections are shown in green and orange. PP= Primary Pulse, BP = Bubble Pulse. From the study Practical approaches to maximizing the resolution of sparker seismic reflection data.
Sub seafloor structure of landslide in Santa Barbara Channel, CA
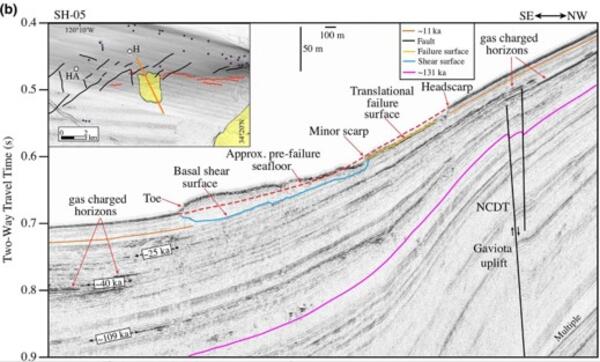
Example imagery revealing the sub-seafloor structure below a submarine landslide in the Santa Barbara Channel, offshore California. The base of the slide is traced in blue, and the near vertical black lines highlight shallow faults cutting through a zone of uplift located below the slide headscarp.
Example imagery revealing the sub-seafloor structure below a submarine landslide in the Santa Barbara Channel, offshore California. The base of the slide is traced in blue, and the near vertical black lines highlight shallow faults cutting through a zone of uplift located below the slide headscarp.

Example sparker data from Cascadia Subduction Zone showing multiple ghost reflections
Example sparker data from Cascadia Subduction Zone showing multiple ghost reflections that reduce the overall resolution of the image.
Example sparker data from Cascadia Subduction Zone showing multiple ghost reflections that reduce the overall resolution of the image.

Cascadia sparker data with ghosts removed, with annotation identifying geologic contacts, offset layers, and a submarine landslide deposit
linkExample of sparker data from the Cascadia Subduction Zone with ghost reflections removed, with annotation identifying geologic contacts, offset layers, and a submarine landslide deposit

Animated GIF of fault zone outcrop from late Miocene–Pliocene period, Western Macedonia, Greece
linkAnimated GIF of fault zone outcrop from late Miocene–Pliocene period, Western Macedonia, Greece. Subsequent images are overlays that are offset with colors inverted, to simulate ghost reflections found in sparker seismic data.
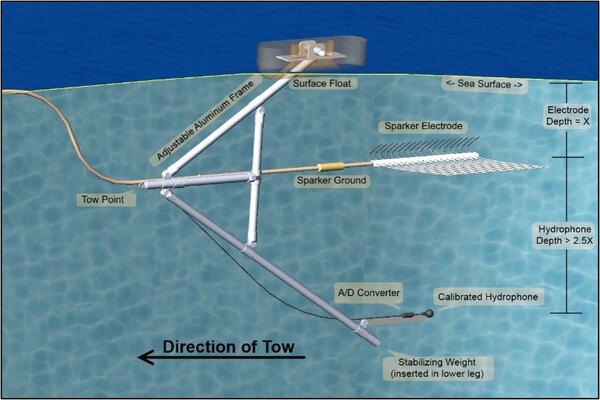
Diagram of ghostbuster system designed to record signature of outgoing sparker source
Diagram of system designed to record signature of outgoing sparker source, from the study Practical approaches to maximizing the resolution of sparker seismic reflection data.
Diagram of system designed to record signature of outgoing sparker source, from the study Practical approaches to maximizing the resolution of sparker seismic reflection data.
Videos
")
USGS Sediment Core Laboratory (AD)
USGS scientists collect core samples from estuaries, lakes, coasts, and marine environments to study a range of physical and chemical properties preserved in sediment or coral over time. They process and analyze these core samples at the Pacific Coastal and Marine Science Center’s Sediment Core Lab.
USGS scientists collect core samples from estuaries, lakes, coasts, and marine environments to study a range of physical and chemical properties preserved in sediment or coral over time. They process and analyze these core samples at the Pacific Coastal and Marine Science Center’s Sediment Core Lab.
USGS Sediment Core Laboratory
USGS scientists collect core samples from estuaries, lakes, coasts, and marine environments to study a range of physical and chemical properties preserved in sediment or coral over time. They process and analyze these core samples at the Pacific Coastal and Marine Science Center’s Sediment Core Lab.
USGS scientists collect core samples from estuaries, lakes, coasts, and marine environments to study a range of physical and chemical properties preserved in sediment or coral over time. They process and analyze these core samples at the Pacific Coastal and Marine Science Center’s Sediment Core Lab.

Science of Surfing
Join USGS Research Geologist and lifelong surfer Jon Warrick at the Pacific Coastal and Marine Science Center Santa Cruz as he discusses how coastal and ocean geoscience contributes to a better understanding of how waves form and behave as they approach the shore—critical information with a broad range of applications, not least of which is surfing!
Join USGS Research Geologist and lifelong surfer Jon Warrick at the Pacific Coastal and Marine Science Center Santa Cruz as he discusses how coastal and ocean geoscience contributes to a better understanding of how waves form and behave as they approach the shore—critical information with a broad range of applications, not least of which is surfing!
Science of Surfing (AD)
Join USGS Research Geologist and lifelong surfer Jon Warrick at the Pacific Coastal and Marine Science Center Santa Cruz as he discusses how coastal and ocean geoscience contribute to a better understanding of how waves form and behave as they approach the shore—critical information with a broad range of applications, not least of which is surfing!
Join USGS Research Geologist and lifelong surfer Jon Warrick at the Pacific Coastal and Marine Science Center Santa Cruz as he discusses how coastal and ocean geoscience contribute to a better understanding of how waves form and behave as they approach the shore—critical information with a broad range of applications, not least of which is surfing!

Introduction to the USGS Coastal Science Navigator
The Coastal Science Navigator is intended to help users discover USGS Coastal Change Hazards information, products, and tools relevant to their scientific or decision-making needs.
The Coastal Science Navigator is intended to help users discover USGS Coastal Change Hazards information, products, and tools relevant to their scientific or decision-making needs.
")
Jet Ski Bathymetric Surveying (AD)
The USGS uses a variety of survey tools—including personal watercraft (jet skis) equipped with GPS and sonar—to measure how sandy coastlines change over time. Sandy coastlines are a valuable resource that protect human-made structures from waves, serve as habitat for important species, and provide a variety of recreational opportunities.
The USGS uses a variety of survey tools—including personal watercraft (jet skis) equipped with GPS and sonar—to measure how sandy coastlines change over time. Sandy coastlines are a valuable resource that protect human-made structures from waves, serve as habitat for important species, and provide a variety of recreational opportunities.
Webcams
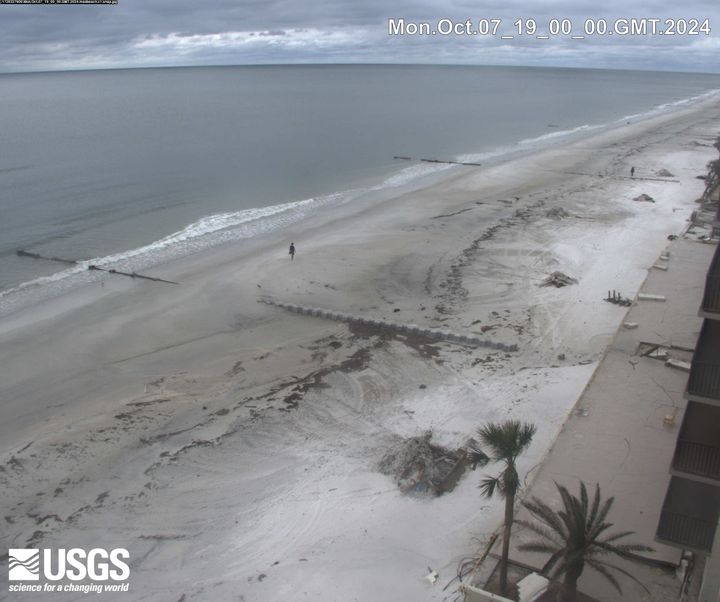
Sand Key, Florida
The most recent view of the beach from a coastal camera on Sand Key, Florida. Updates every 60 minutes.
The most recent view of the beach from a coastal camera on Sand Key, Florida. Updates every 60 minutes.
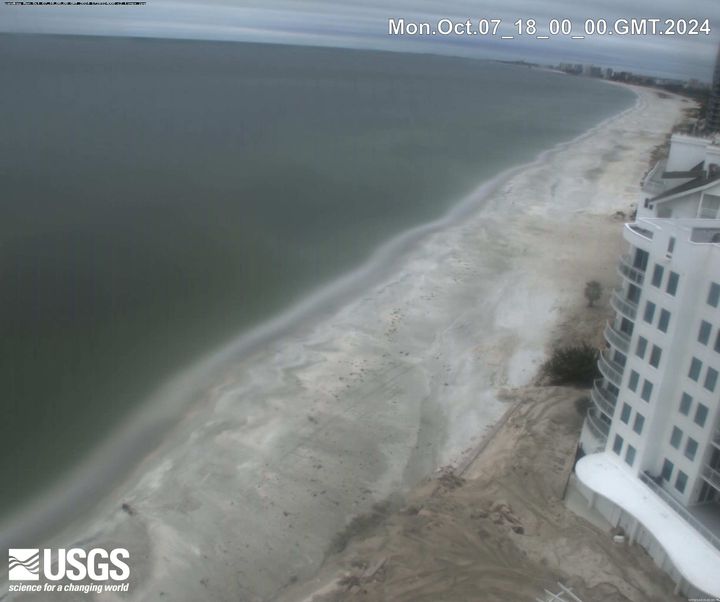
Madeira Beach
A coastal camera located on Medeira Beach, Florida near the Shoreline Island Resort.
A coastal camera located on Medeira Beach, Florida near the Shoreline Island Resort.
Nuvuk video camera 2 dark image
Two video cameras are installed atop a utility pole near the northernmost point of land in the United States at Nuvuk (Point Barrow), Alaska. The cameras point northwest toward the Arctic Ocean and the boundary between the Chukchi and Beaufort Seas. Every half hour during daylight hours, the cameras collect snapshots and video for 10 minutes.
Two video cameras are installed atop a utility pole near the northernmost point of land in the United States at Nuvuk (Point Barrow), Alaska. The cameras point northwest toward the Arctic Ocean and the boundary between the Chukchi and Beaufort Seas. Every half hour during daylight hours, the cameras collect snapshots and video for 10 minutes.

Nuvuk video camera 1 dark image
Two video cameras are installed atop a utility pole near the northernmost point of land in the United States at Nuvuk (Point Barrow), Alaska. The cameras point northwest toward the Arctic Ocean and the boundary between the Chukchi and Beaufort Seas. Every half hour during daylight hours, the cameras collect snapshots and video for 10 minutes.
Two video cameras are installed atop a utility pole near the northernmost point of land in the United States at Nuvuk (Point Barrow), Alaska. The cameras point northwest toward the Arctic Ocean and the boundary between the Chukchi and Beaufort Seas. Every half hour during daylight hours, the cameras collect snapshots and video for 10 minutes.

Nuvuk video camera 2 bright image
Two video cameras are installed atop a utility pole near the northernmost point of land in the United States at Nuvuk (Point Barrow), Alaska. The cameras point northwest toward the Arctic Ocean and the boundary between the Chukchi and Beaufort Seas. Every half hour during daylight hours, the cameras collect snapshots and video for 10 minutes.
Two video cameras are installed atop a utility pole near the northernmost point of land in the United States at Nuvuk (Point Barrow), Alaska. The cameras point northwest toward the Arctic Ocean and the boundary between the Chukchi and Beaufort Seas. Every half hour during daylight hours, the cameras collect snapshots and video for 10 minutes.

Nuvuk video camera 2 variance image
Two video cameras are installed atop a utility pole near the northernmost point of land in the United States at Nuvuk (Point Barrow), Alaska. The cameras point northwest toward the Arctic Ocean and the boundary between the Chukchi and Beaufort Seas. Every half hour during daylight hours, the cameras collect snapshots and video for 10 minutes.
Two video cameras are installed atop a utility pole near the northernmost point of land in the United States at Nuvuk (Point Barrow), Alaska. The cameras point northwest toward the Arctic Ocean and the boundary between the Chukchi and Beaufort Seas. Every half hour during daylight hours, the cameras collect snapshots and video for 10 minutes.