
Using the Land Product Characterization System
The Land Product Characterization System (LPCS) has the capability to trend system characterizations for various sensors, providing users the ability to do comparative analysis of satellite data and products. This resource has been developed and is managed by the USGS Requirements, Capabilities and Analysis for Earth Observation (RCA-EO) team.
The information contained in the Land Product Characterization System is updated regularly, based on data available from satellite owners and other resources, and can be used freely, endorsing the USGS for publications. The LPCS is currently going through phased development.
Please use the suggested citation when referencing the LPCS:
Anderson, C., Powell, L., Kim, M., Ranjitkar, B., and Rusten, T., 2023, Land Product Characterization System: U.S. Geological Survey digital data, https://calval.cr.usgs.gov/apps/lpcs.
Note: The RCA-EO team or the USGS do not warrant the accuracy, completeness, or usefulness of this information. Also, any use of trade, firm, or product names is for descriptive purposes only and does not imply endorsement by the U.S. Government.
System Requirements
Current web and mobile browsers that support JavaScript and stylesheets are recommended. Systems that have the latest version of the following browsers can utilize LPCS:
- Microsoft Edge
- Mozilla Firefox
- Google Chrome
- Safari
- Default iOS/Android Browser
For the best display, it is recommended to set the resolution of screen to be at least 1024 pixel x 768 pixel resolution.
Using the LPCS
The main page of the LPCS (shown below) displays trending parameters: Characterization Method, Satellite/Sensor, Product Level, Attribute, Band, and Location. The tool reports the trending results based on the filters.
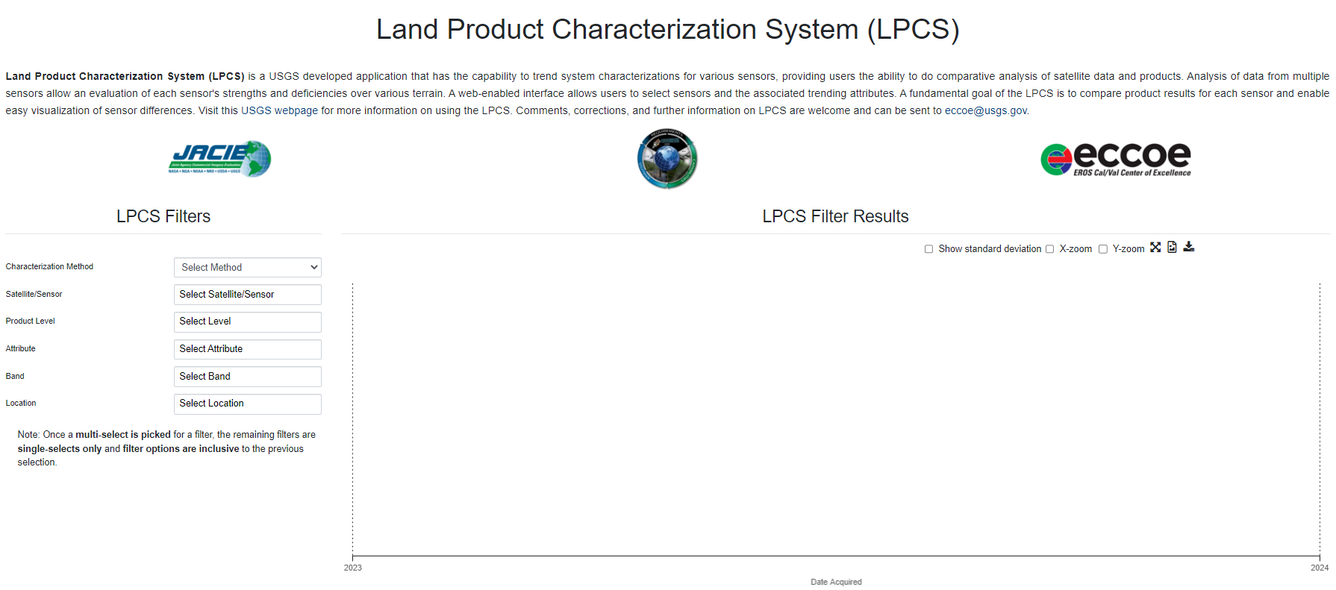
Filters
The filters shown on the left side of the page can be used to narrow the results:
- Characterization Method: Select the desired characterization method to trend the data
- Satellite/Sensor: Select the desired satellite/sensor based on the previous filter select
- Product Level: Select the desired product level based on the previous filter selects
- Attribute: Select the desired attribute based on the previous filter selects
- Band: Select the desired band based on the previous filter selects
- Location: Select the desired location based on the previous filter selects
The Characterization Method filter is a single-select filter. All other filters are multiple-select filters. Once a multiple-select is picked for a filter, the remaining filters are single-selects only. Filter options are inclusive to the previous selection.
Show Standard Deviation
The show standard deviation option on the top right of the results adds standard deviation to the chart. Standard deviation can be turned on or off by clicking the check box to the left of the show standard deviation text. Checking/unchecking 'Show standard deviation' resets the chart.
X-Zoom
The x-zoom option on the top right of the results zooms the chart on the x-axis.
Y-Zoom
The y-zoom option on the top right of the results zooms the chart on the y-axis.
Reset Zoom
The reset zoom icon on the top right of the results restores the chart back to the original view.
Save Chart
The save chart icon on the top right of the results saves the chart as a PNG image.
To save the chart with the data points displayed, hover the mouse over a data point, right click on the chart and choose ‘Save image as’.
Save Data as Zip
The save data as zip icon on the top right of the results can be used to save files of the filtered data used to create the chart. Each data set filtered is saved as a separate CSV file. All CSV files are zipped as one file.
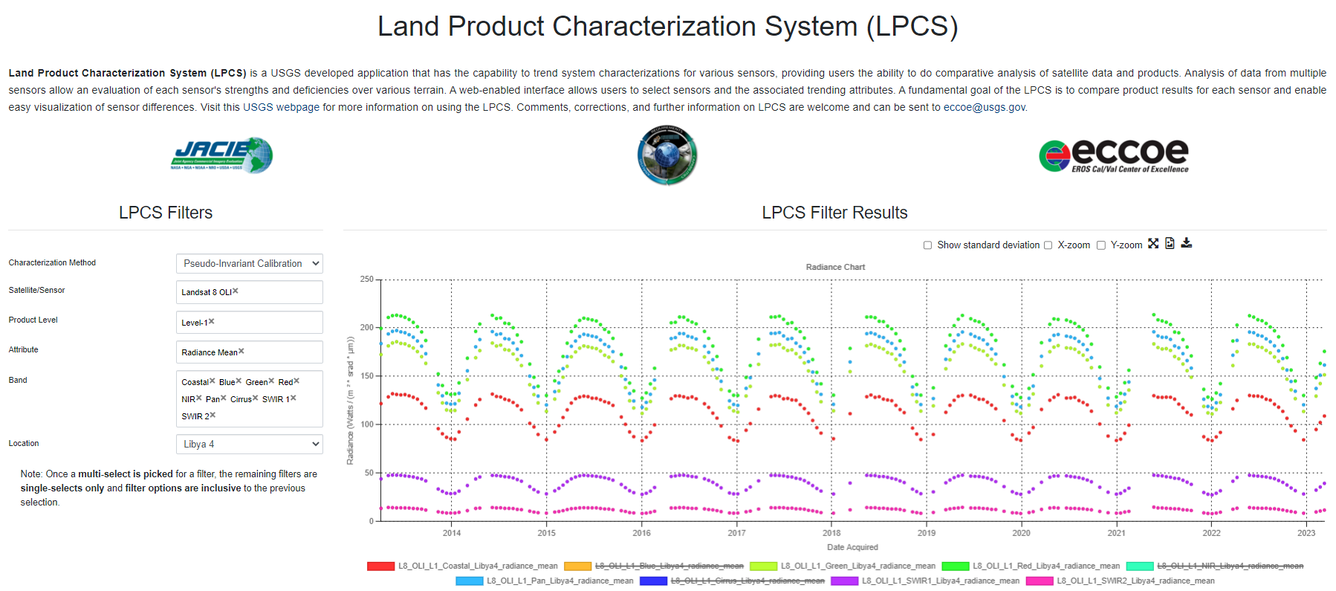
Chart Details
As seen in the example chart below, radiance is shown for Landsat 8 OLI over Libya 4 based on the filters chosen on the left. The vertical bar represents the date acquired and displays the radiance for each of the selected bands relative to that date. The colors on the attribute chart are for illustrative purposes only. No color is repeated.
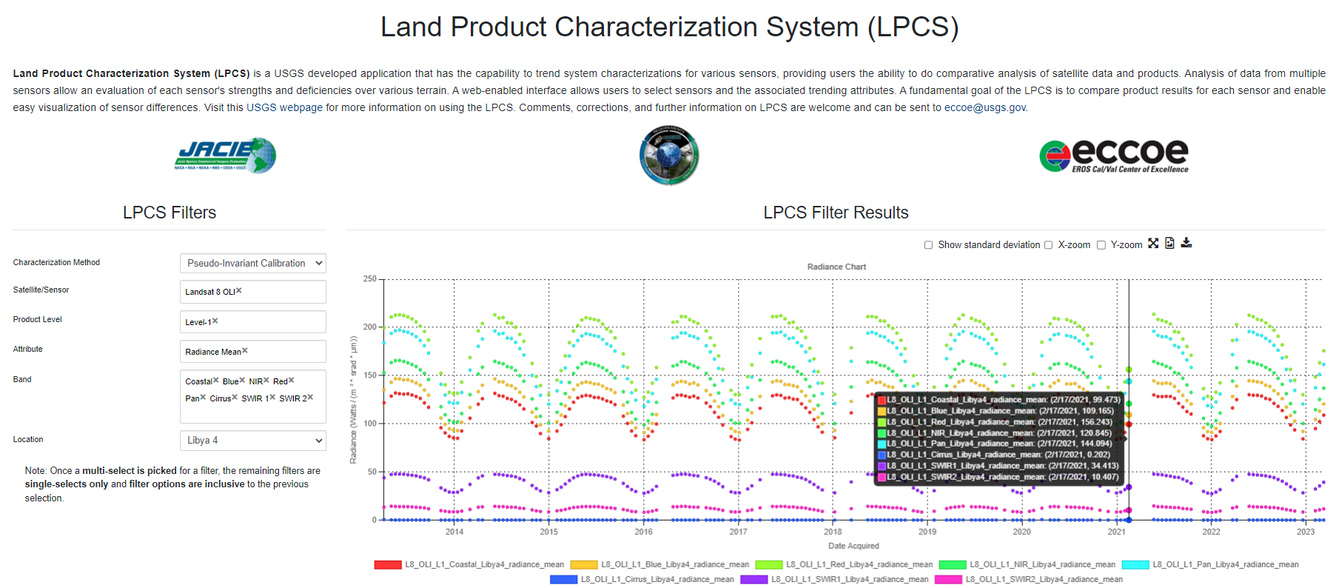
Chart with Standard Deviation
Standard deviation can be included on the chart as shown below. The show standard deviation option on the top right of the results adds standard deviation to the chart. Standard deviation can be turned on or off by clicking the check box to the left of the show standard deviation text. Checking/unchecking 'Show standard deviation' resets the chart.
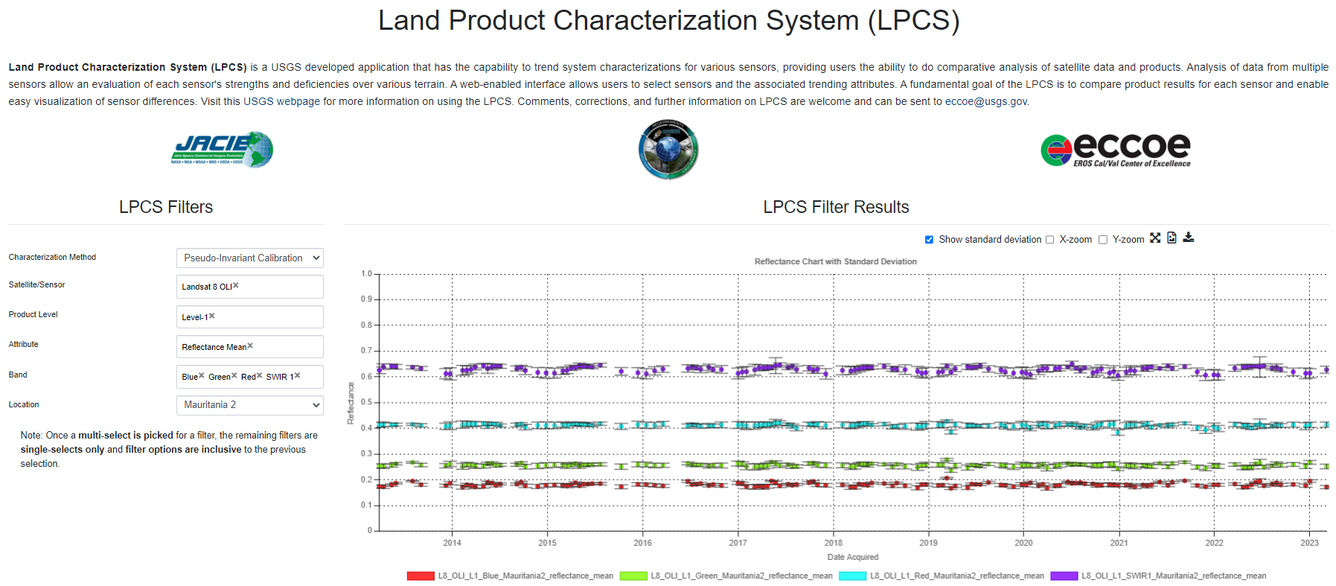
Chart with Zoom
he chart can be zoomed on the x-axis and/or the y-axis by selecting the check boxes in the upper right corner. Once the desired zoom is selected, the chart can be zoomed in (scroll up using mouse or stretch using fingers for touch devices) or out (scroll down using mouse or pinch using fingers for touch devices) as shown below.
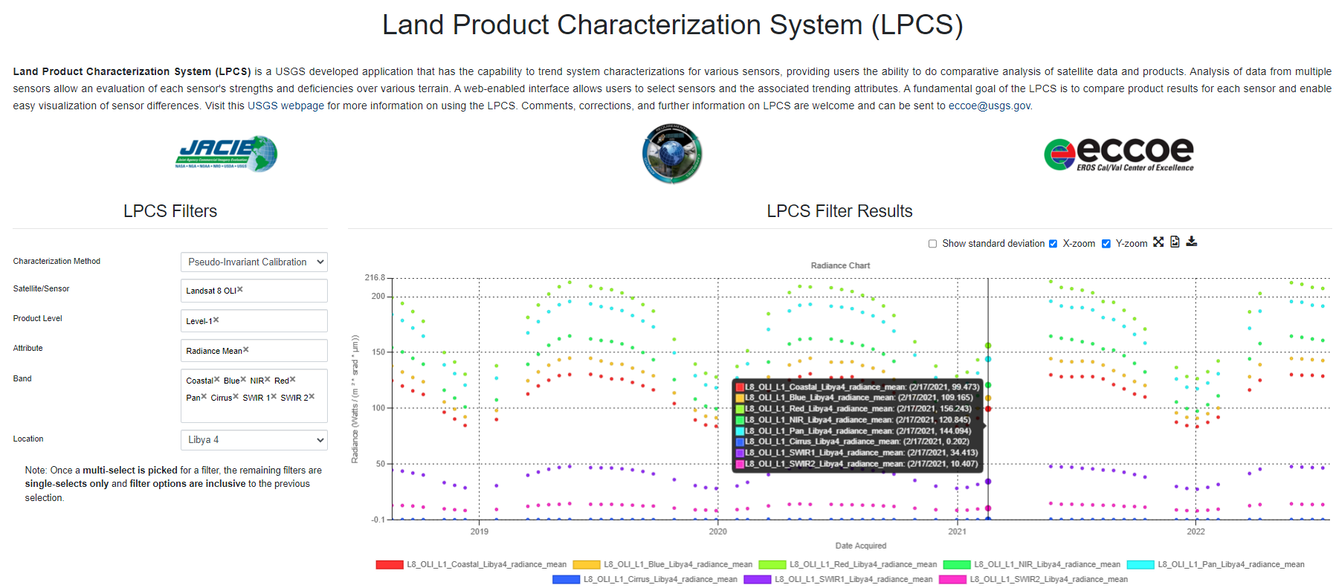
Chart with Multiple Y-Axes
If more than one attribute is selected, both y-axes are shown in the chart as illustrated below.
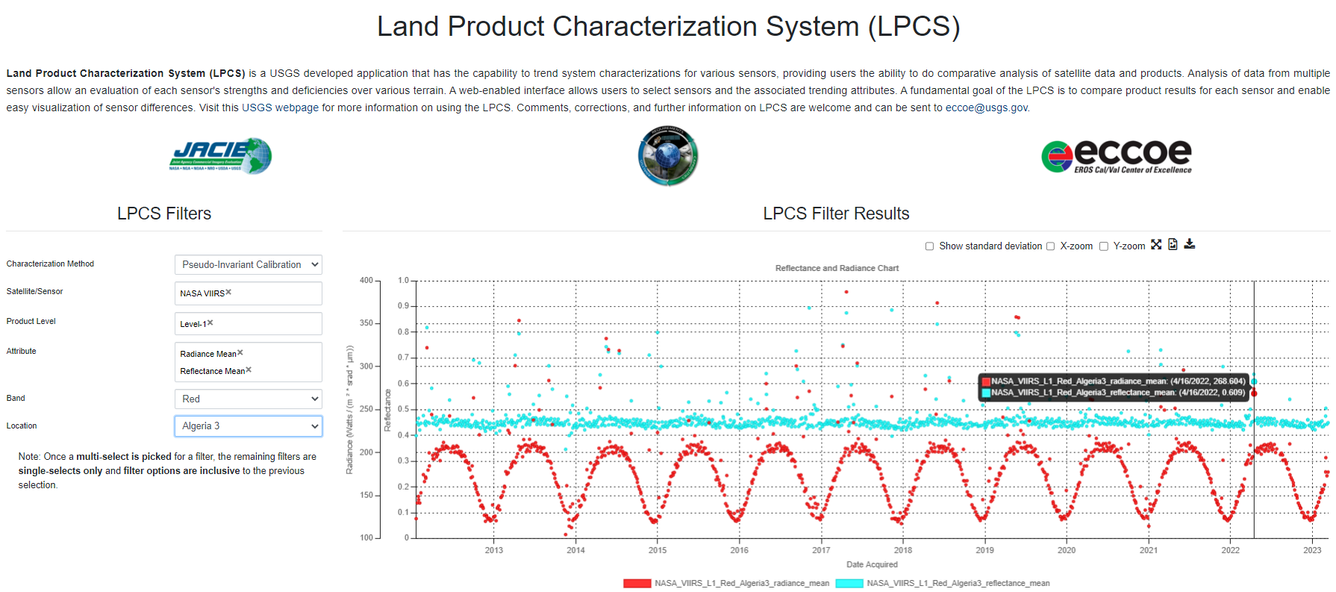
Chart Toggling
The chart allows toggling on and off series by clicking the series' legend as shown below.
Slow Response
If the initial page loading is slow, please clear the browser cache and reload the page.
Contact Information
Any questions about the Land Product Characterization System can be sent to eccoe@usgs.gov.