
These simplified plots of earthquake magnitude versus time show the differences between tectonic earthquake sequences and magmatic earthquake swarms. Figure by Alicia Hotovec-Ellis, USGS.
Multimedia
Images
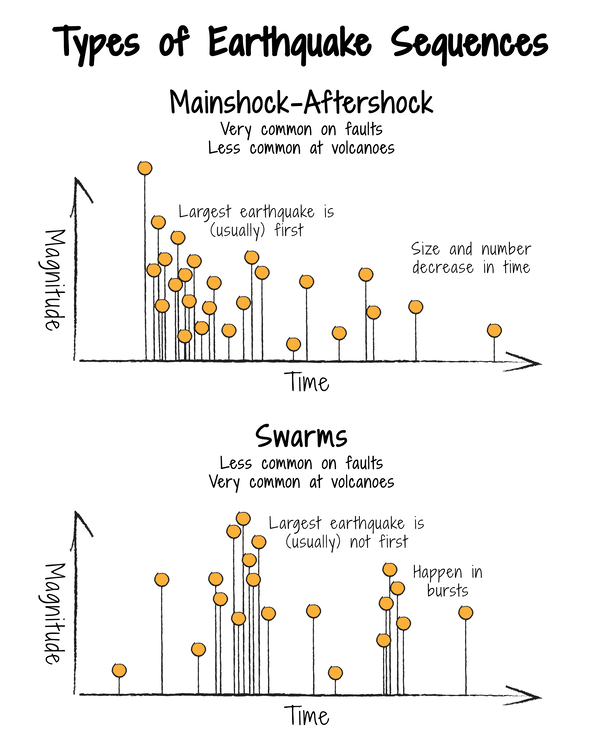
Types of earthquake sequences
These simplified plots of earthquake magnitude versus time show the differences between tectonic earthquake sequences and magmatic earthquake swarms. Figure by Alicia Hotovec-Ellis, USGS.
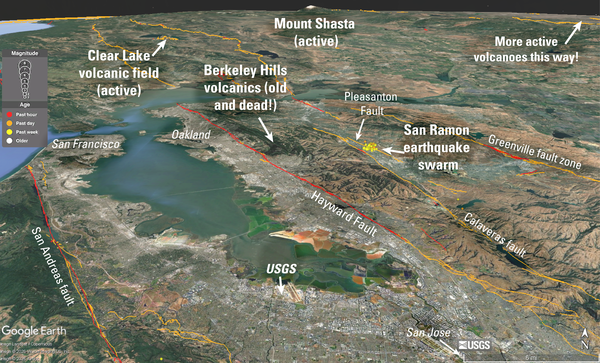
Map of the January-February 2026 San Ramon earthquake swarm, Bay area faults, and volcanic areas
Map of the January-February 2026 San Ramon earthquake swarm, Bay area faults, and volcanic areasThis oblique Google Earth map shows the location of the 2026 San Ramon earthquake swarm, along with notable faults in the San Francisco Bay area and the nearest volcanic areas to the swarm. Google Earth image modified by J. Ball, USGS.
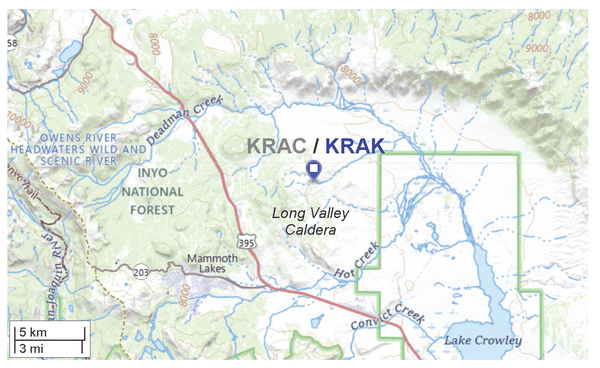
Location of GPS (GNSS) station KRAC/KRAK in the Long Valley Caldera
Location of GPS (GNSS) station KRAC/KRAK in the Long Valley CalderaThe location of GPS station KRAC and its predecessor KRAK, slightly north of the center of deflation in Long Valley. USGS figure by Josh Crozier and Alicia Hotovec-Ellis.
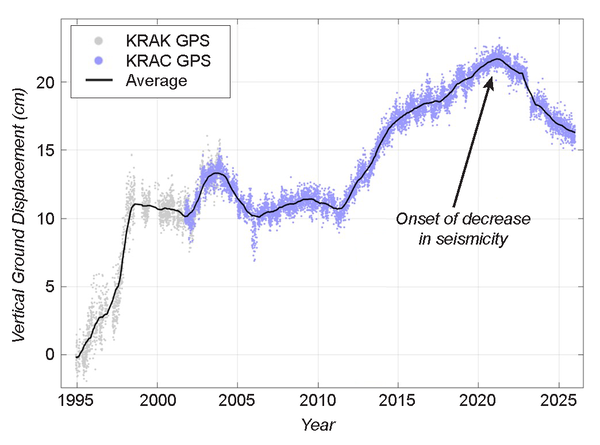
The average of individual measurements from GPS station KRAC/KRAK in the Long Valley Caldera, 1995-2025
The average of individual measurements from GPS station KRAC/KRAK in the Long Valley Caldera, 1995-2025The average of individual measurements from GPS station KRAC/KRAK shows about 6 cm of ground subsidence since 2021. The multi-year deflation stands out above smaller fluctuations caused by noise in the data and seasonal water infiltration (the peaks and troughs in the dots for individual measurements). USGS figure by Josh Crozier and Alicia Hotovec-Ellis.
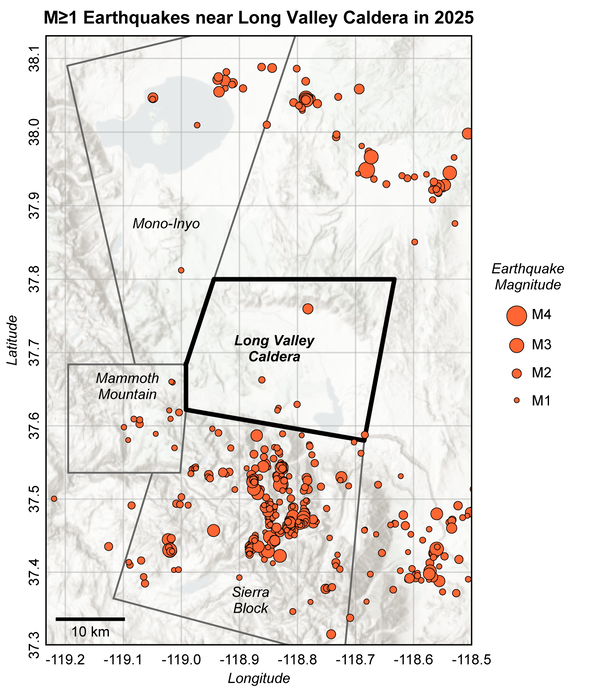
Map of the Long Valley region with earthquakes from 2025
Map of the Long Valley region with earthquakes from 2025Locations of earthquakes of at least magnitude 1.0 in 2025 and the outlines of the boxes CalVO uses to count earthquakes around Long Valley. Only 6 earthquakes were located inside the Long Valley Caldera box. (Earthquake location data from Northern California Seismic Network.) Figure by Alicia Hotovec-Ellis, USGS.
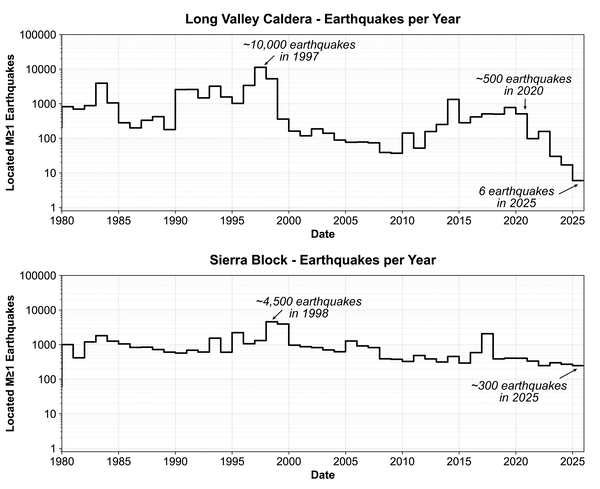
Earthquakes per year from 1980-2026 in Long Valley and the nearby Sierra Nevada
Earthquakes per year from 1980-2026 in Long Valley and the nearby Sierra NevadaGraphs of the number of earthquakes located each year since 1980 in the Long Valley Caldera and nearby Sierra Block monitoring boxes. Note that the number of earthquakes on the left shown on a logarithmic scale, which means they increase an order of magnitude with each "step." Figure by Alicia Hotovec-Ellis, USGS.