


Earthquakes affect Earth’s intricate plumbing system. The magnitude 9.0 earthquake in Japan on March 11, 2011 affected water levels in groundwater wells in many places in the United States. In this episode of CoreCast USGS Geophysicist Evelyn Roeloffs explains this phenomenon.
The Christiansburg Well: Sensing Worldwide Earthquakes
Due to a quirk of local geology, a well in Christiansburg, Virginia is sensitive to seismic waves generated by large earthquakes that occur around the world. This well can be thought of as a natural seismograph: when seismic waves travel past, the water levels in this well rise and fall rapidly. This well gives us a peek into the ways the Earth beneath our feet is constantly changing.
Video: Groundwater Response to Guatemalan Earthquake 2012
Video: Groundwater Response to Guatemalan Earthquake 2012

Video captured by scientists from the USGS and the Virginia Department on Environmental Quality in November 2012 shows groundwater oscillations in the Christiansburg well following a magnitude 7.4 earthquake in Guatemala, 1,738 miles away.
Podcast: Waves Rippling Through Groundwater
Podcast: Waves Rippling Through Groundwater

This phenomenon of earthquakes affecting groundwater levels was featured on an episode of the USGS podcast CoreCast. USGS Geophysicist Evelyn Roeloffs explains.
Observation well 27F2 SOW 019, more commonly known as the 'Christiansburg Well', is a water quality monitoring well located in Christiansburg, Virginia. What makes the Christiansburg Well interesting and unique is that it is sensitive to teleseismic waves generated by large earthquakes that occur all around the world. After a large earthquake, the water levels in the well will often rise and fall rapidly, even if the earthquake in question occurred on the other side of the world.
How Does It Work?
Water levels in the Christiansburg well are always rising and falling due to earth tides. Earth tides are a phenomenon similar to ocean tides, but affect our solid earth rather than ocean water levels. Earth tides and even changes in barometric pressure can effect the water levels in some wells, including the well at Christiansburg. Twice a day, the water levels in the Christiansburg well gradually rise and fall just like ocean tides.
Media

Sources/Usage: Public Domain. View Media Details
However, sometimes the water levels in this well change not-so-gradually. These rapid changes in water level are often due to earthquakes.
Teleseismic waves are waves caused by earthquakes that have travelled long distances through the Earth's subsurface. As these waves travel through rock formations, they can squeeze and stretch the rocks. In water-bearing rocks, or aquifers, this deformation can rapidly force water in and out of nearby wells.
Media

Sources/Usage: Public Domain. View Media Details
The Christiansburg Well draws water from the Elbrook Formation, which is a fractured rock aquifer made up of mostly limestone and dolomite that is part of the Valley and Ridge aquifers.
Media

Sources/Usage: Public Domain. View Media Details
Water enters the well via fractures or cracks in the rock. These fractures compress and expand as seismic waves pass through, causing the water to be drawn in and out of the well, similar to the way bellows work. As groundwater moves in and out of the well, the water level in the well rapidly rises and falls.
This water-level oscillation is recorded at 5-minute intervals by a pressure transducer and data logger maintained by our partners at the Virginia Department of Environmental Quality. Every hour, these data are transmitted via satellite to USGS servers and are available to view on the Christiansburg Well's site on Water Data For The Nation.
Because data is only recorded every 5 minutes, brief or low-magnitude water level fluctuations aren't always picked up in the record. However, many events are still recorded in this well's water level records. Evidence of an earthquake can appear as a sudden rise or fall in water levels, or as water levels oscillating up and down over a period of time. You can explore some of the more recent events in the table below, or check out older events recorded on our legacy site.
Recent Earthquakes
Below is a list of selected recent visible water-level responses in the Christiansburg Well and large earthquakes that preceded these changes.
This table is scrollable. Scroll right and left to see all relevant information. Click on the hydrographs for larger images. The time of the earthquake is shown as a red line just before water level oscillations are recorded.
Important: Data may be provisional
| Hydrograph (click for full size) | Earthquake Location | Earthquake Magnitude | Date and Time (UTC) | Date and Time (EST) | Depth of Epicenter (miles) | Haversine Distance from Epicenter to Well (miles) | Water Level Rise (feet below land surface) | Water Level Fall (feet below land surface) | Total Change (feet) | Ground Motion Visualization (via EarthScope) |
|---|---|---|---|---|---|---|---|---|---|---|
|
Media
Sources/Usage: Public Domain. View Media Details
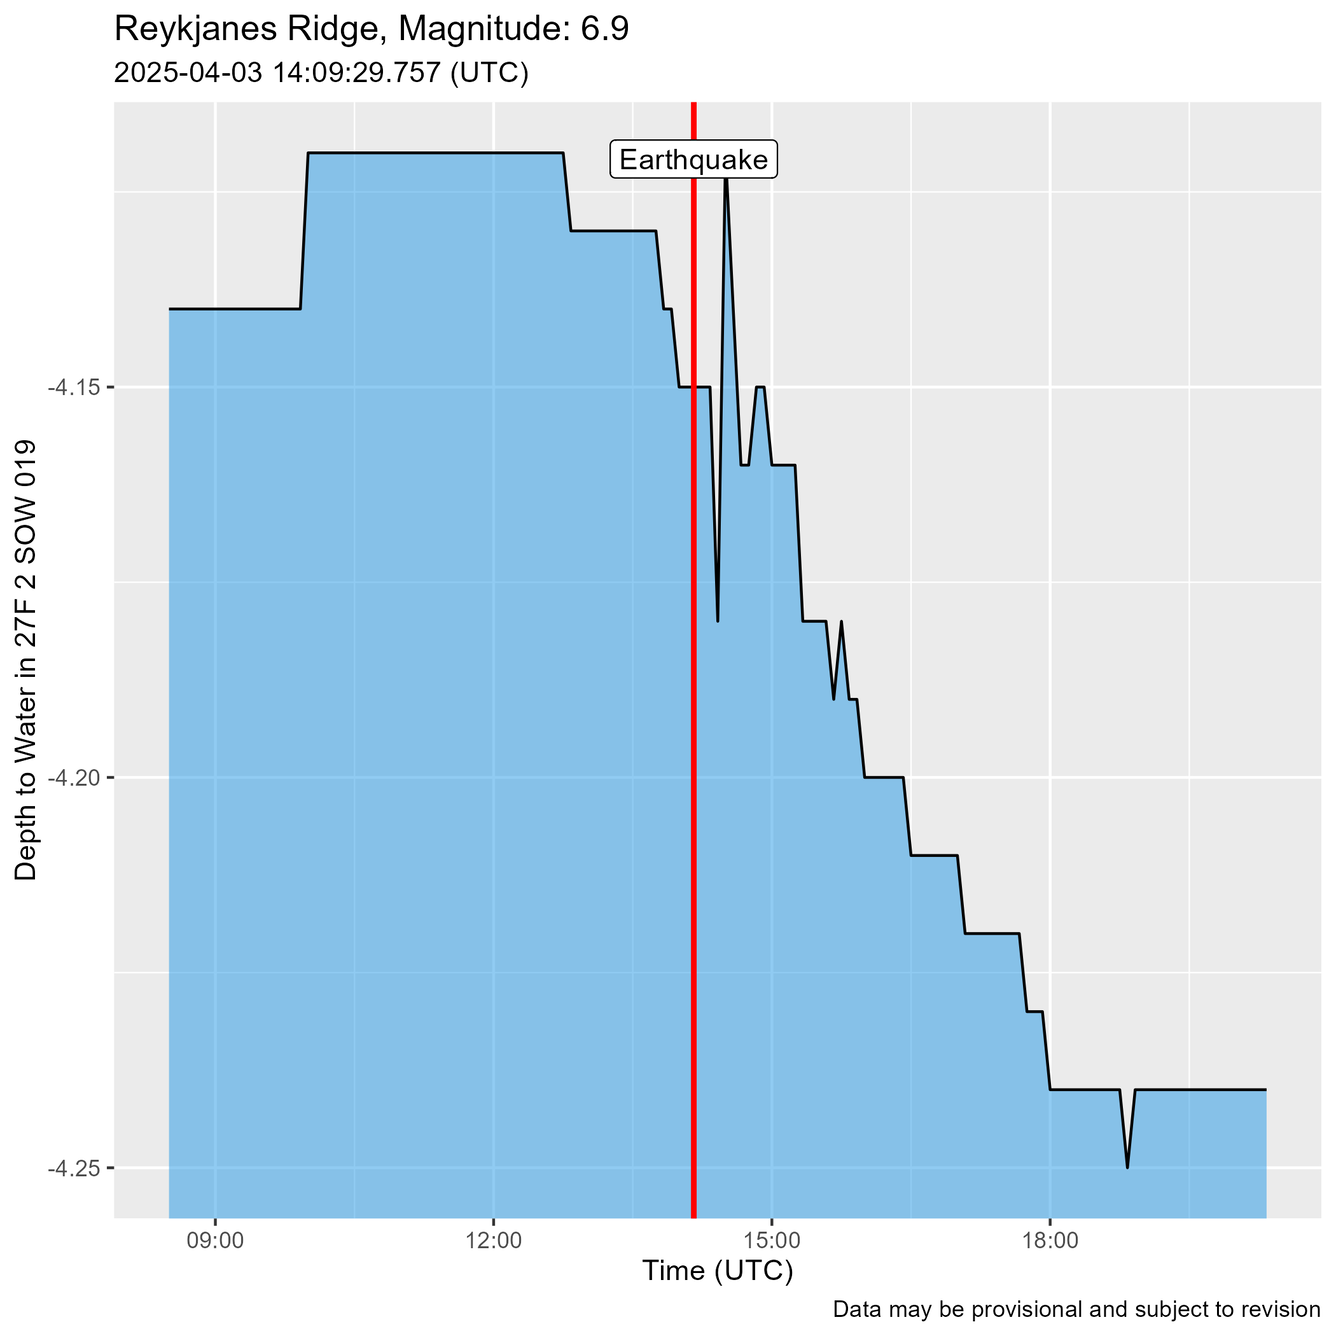
| Reykjanes Ridge | 6.9 | 4/3/2025 2:09 PM | 4/3/2025 9:09 AM | 6.2 | 2536.6 | 3.99 | 3.94 | 0.05 | Click Here |
|
Media
Sources/Usage: Public Domain. View Media Details
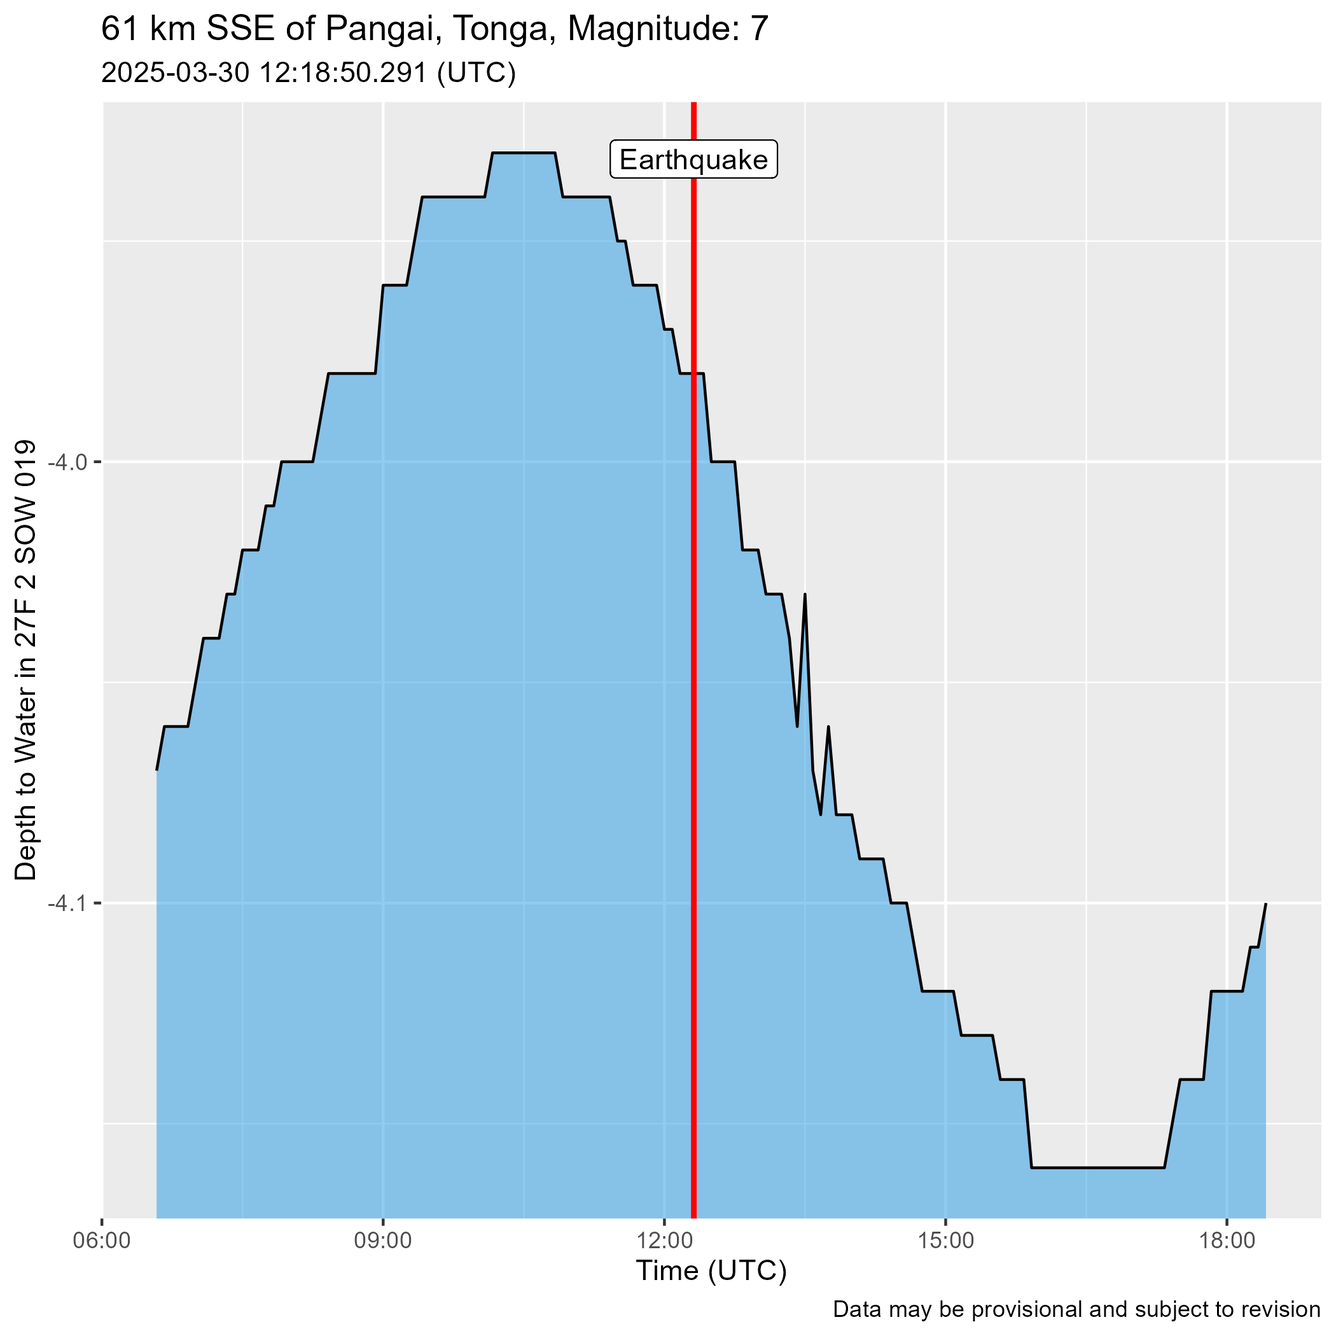
| 61 km SSE of Pangai, Tonga | 7 | 3/30/2025 12:18 PM | 3/30/2025 7:18 AM | 18.0 | 7247.9 | 4.00 | 4.00 | 0.00 | Click Here |
|
Media

Sources/Usage: Public Domain. View Media Details
| 2025 Sagaing, Burma (Myanmar) Earthquake | 7.7 | 3/28/2025 6:20 AM | 3/28/2025 1:20 AM | 6.2 | 8344.4 | 4.18 | 4.12 | 0.06 | Click Here |
|
Media
Sources/Usage: Public Domain. View Media Details
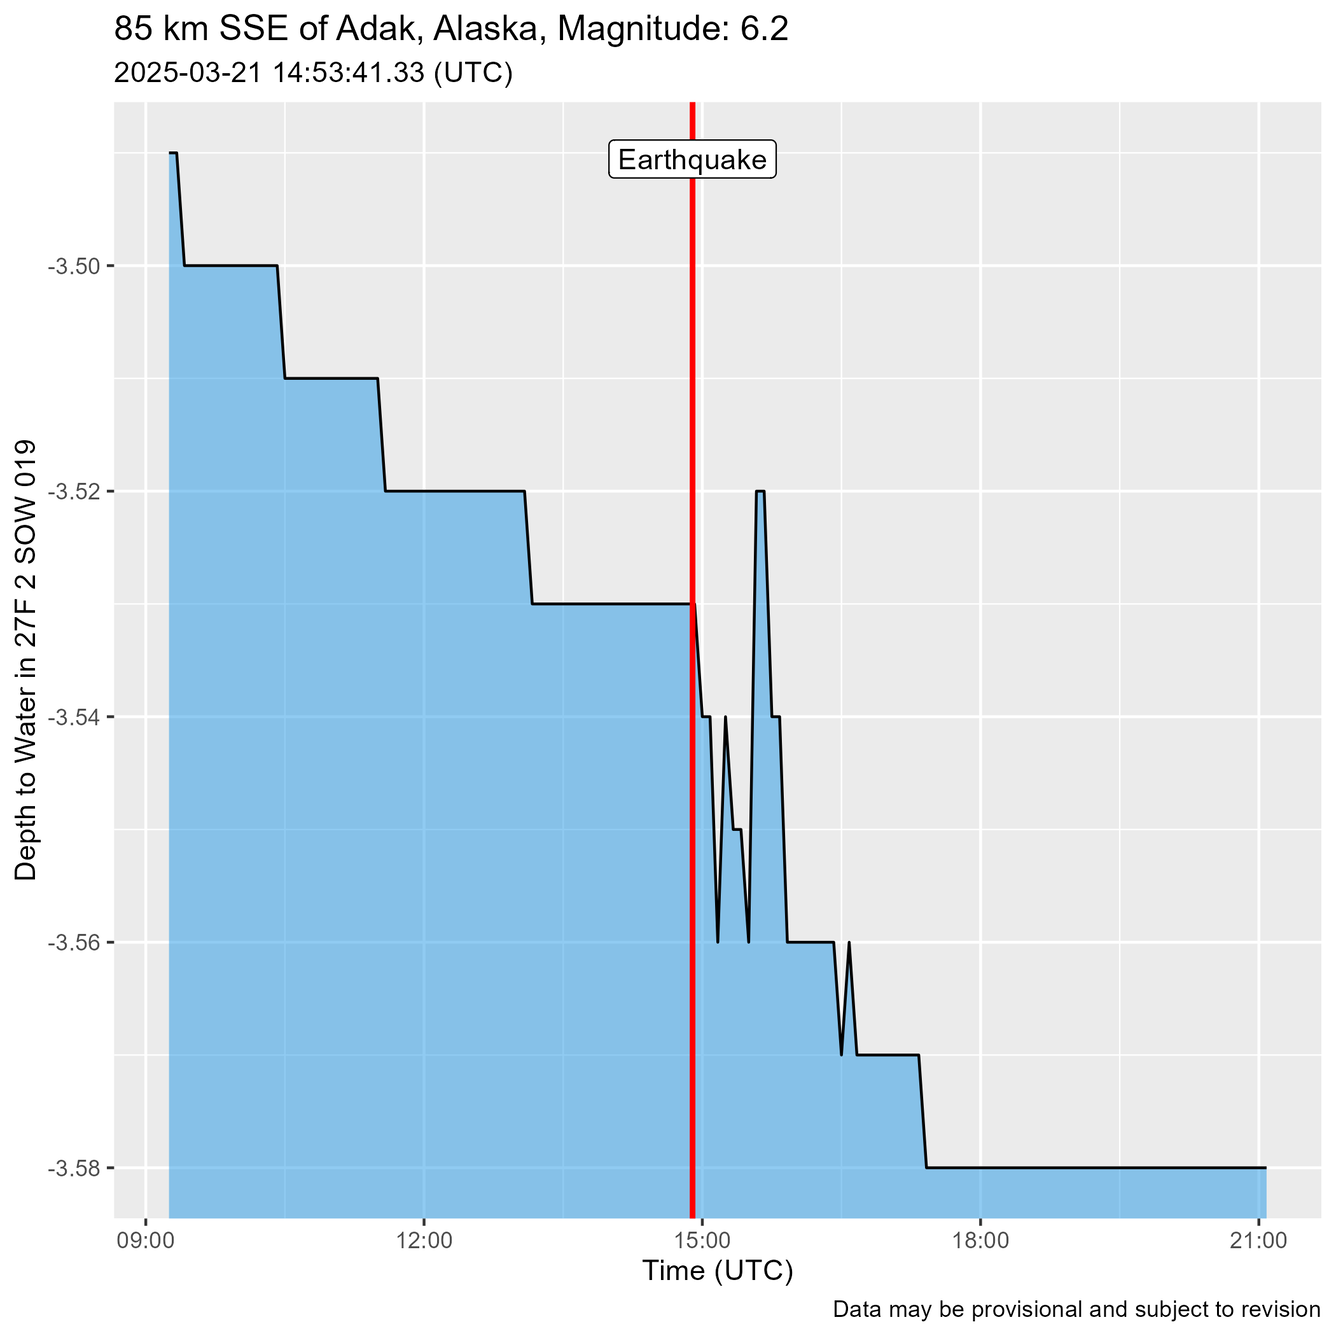
| 85 km SSE of Adak, Alaska | 6.2 | 3/21/2025 2:53 PM | 3/21/2025 9:53 AM | 10.6 | 4500.0 | 3.56 | 3.54 | 0.02 | Click Here |
|
Media

Sources/Usage: Public Domain. View Media Details
| 120 km SSE of Burica, Panama | 6.2 | 3/21/2025 2:50 PM | 3/21/2025 9:50 AM | 6.2 | 2082.7 | 3.56 | 3.54 | 0.02 | Click Here |
|
Media

Sources/Usage: Public Domain. View Media Details
| 209 km SSW of George Town, Cayman Islands | 7.6 | 2/8/2025 11:23 PM | 2/8/2025 6:23 PM | 6.2 | 1348.5 | 3.59 | 2.74 | 0.85 | Click Here |
|
Media

Sources/Usage: Public Domain. View Media Details
| 18 km SE of Miyazaki, Japan | 6.8 | 1/13/2025 12:19 PM | 1/13/2025 7:19 AM | 22.4 | 7245.1 | 5.22 | 5.16 | 0.06 | Click Here |
|
Media

Sources/Usage: Public Domain. View Media Details
| Southern Tibetan Plateau | 7.1 | 1/7/2025 1:05 AM | 1/6/2025 8:05 PM | 0.6 | 7824.3 | 4.73 | 4.55 | 0.18 | Click Here |
|
Media

Sources/Usage: Public Domain. View Media Details
| 30 km W of Port-Vila, Vanuatu | 7.3 | 12/17/2024 1:47 AM | 12/16/2024 8:47 PM | 35.5 | 8118.0 | 4.90 | 4.78 | 0.12 | Click Here |
|
Media
Sources/Usage: Public Domain. View Media Details
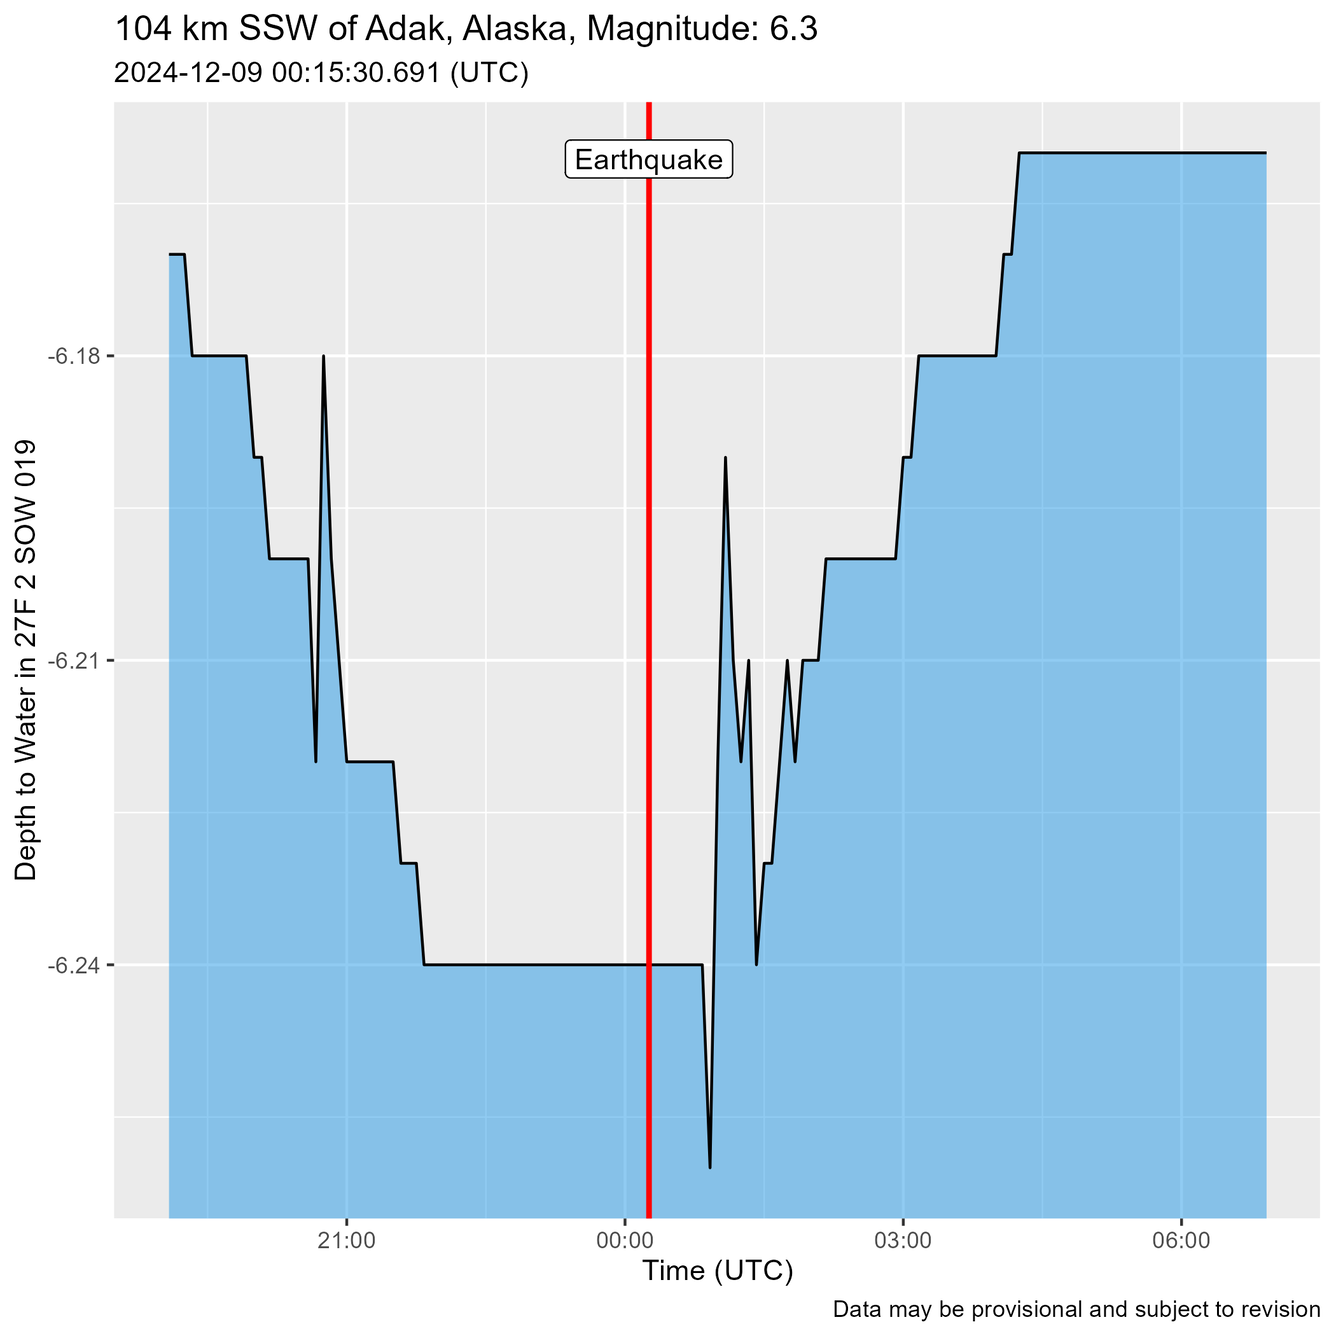
| 104 km SSW of Adak, Alaska | 6.3 | 12.9/2024 12:15 AM | 12/8/2024 7:15 PM | 11.8 | 4545.0 | 6.26 | 6.19 | 0.07 | Click Here |
|
Media

Sources/Usage: Public Domain. View Media Details
| 108 km SSW of Adak, Alaska | 6.3 | 12/8/2024 7:57 PM | 12/8/2024 2:57 PM | 11.2 | 4550.6 | 6.22 | 6.18 | 0.04 | Click Here |
|
Media

Sources/Usage: Public Domain. View Media Details
| Offshore Cape Mendocino, California | 7.0 | 12/5/2024 6:44 PM | 12/5/2024 1:44 PM | 6.2 | 2387.3 | 6.50 | 6.09 | 0.41 | Click Here |
|
Media

Sources/Usage: Public Domain. View Media Details
| 39 km SSW of Bartolomé Masó, Cuba | 6.8 | 11/10/2024 4:49 PM | 11/10/2024 11:49 AM | 8.7 | 1214.3 | 6.19 | 5.92 | 0.27 | Click Here |
|
Media

Sources/Usage: Public Domain. View Media Details
| 40 km WNW of Tamarindo, Costa Rica | 6.2 | 10/12/2024 5:43 PM | 10/12/2024 12:43 PM | 9.9 | 1874.8 | 5.56 | 5.51 | 0.05 | Click Here |
Related
Groundwater-Level Response to Earthquakes
Did you know that earthquakes can cause changes in groundwater levels? Very large earthquakes can even cause water-level fluctuations in some wells thousands of miles away, depending on the local geological conditions around the well.
Groundwater-Level Response to Virginia Earthquake, August 23, 2011
A magnitude 5.8 (Mw) earthquake occurred at 1:51 pm EDT (17:51 UTC) on August 23, 2011, at a depth of about 3.7 miles (6 kilometers) beneath the town of Mineral, Virginia, located approximately 27 miles (45 kilometers) east of Charlottesville. The event is among the largest earthquakes recorded in the eastern United States.
Waves Rippling Through Groundwater
Earthquakes affect Earth’s intricate plumbing system. The magnitude 9.0 earthquake in Japan on March 11, 2011 affected water levels in groundwater wells in many places in the United States. In this episode of CoreCast USGS Geophysicist Evelyn Roeloffs explains this phenomenon.
Earthquakes affect Earth’s intricate plumbing system. The magnitude 9.0 earthquake in Japan on March 11, 2011 affected water levels in groundwater wells in many places in the United States. In this episode of CoreCast USGS Geophysicist Evelyn Roeloffs explains this phenomenon.