
Lidar point cloud rendering of the confluence of the Rio del los Frijoles and the Rio Grande near Bandelier National Monument.
Images
The 3DEP Multimedia Gallery is a collection of graphics related to elevation data. All items in this gallery are considered public domain unless otherwise noted.
Filter Total Items: 76

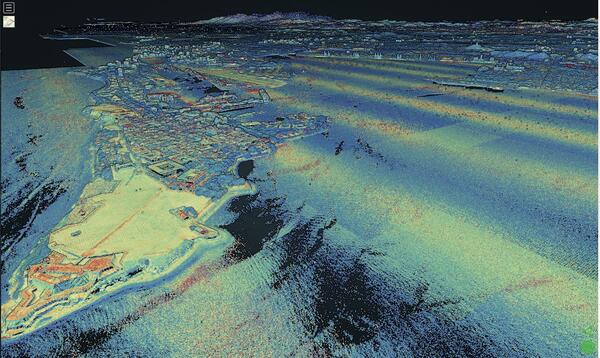
Frijoles Canyon, Bandelier National Monument
Lidar point cloud rendering of the confluence of the Rio del los Frijoles and the Rio Grande near Bandelier National Monument.

White Sands, NM Lidar point cloud rendering
Top down view of lidar point cloud data showing elevation and intensity information of White Sands National Park (U.S. National Park Service). Colors highlight elevation changes within 3m range. USGS_LPC_NM_WhiteSandsNM_2020_D20_w3637n3633.laz
Top down view of lidar point cloud data showing elevation and intensity information of White Sands National Park (U.S. National Park Service). Colors highlight elevation changes within 3m range. USGS_LPC_NM_WhiteSandsNM_2020_D20_w3637n3633.laz

Simulation of a flood event - lidar rendering
Simulation of a flood event in New Mexico near the confluence of the Rio Jemez and Rio Grande Rivers north of Albuquerque.
Simulation of a flood event in New Mexico near the confluence of the Rio Jemez and Rio Grande Rivers north of Albuquerque.

Bisti/ De-Na-Zin Wilderness 3D Lidar Point cloud
3DEP lidar point cloud showing elevation and intensity over the Bisti/De-Na-Zin Wilderness near the Four Corners region of New Mexico.
3DEP lidar point cloud showing elevation and intensity over the Bisti/De-Na-Zin Wilderness near the Four Corners region of New Mexico.

Kasha-Katuwe Tent Rocks National Monument Lidar Point Cloud
Colorized 3DEP lidar point cloud showing intensity and elevation of part of Kasha-Katuwe Tent Rocks National Monument, New Mexico
Colorized 3DEP lidar point cloud showing intensity and elevation of part of Kasha-Katuwe Tent Rocks National Monument, New Mexico

Very Large Array, New Mexico Lidar Point cloud
3DEP lidar point cloud over the Very Large Array Radio Observatory, Socorro, NM. Motion of middle two antennas between flight lines was captured.
3DEP lidar point cloud over the Very Large Array Radio Observatory, Socorro, NM. Motion of middle two antennas between flight lines was captured.

Figure 1. 3D view of lidar point clouds demonstrating QLs
Figure 1. 3D view of lidar point clouds demonstrating differences in point density at each lidar quality level (QL).
Figure 1. 3D view of lidar point clouds demonstrating differences in point density at each lidar quality level (QL).

3DEP Broad Agency Announcement (BAA) Process
Navigate the 3DEP BAA
The 3DEP Broad Agency Announcement (BAA) facilitates partnering with the USGS and other Federal agencies to acquire high-quality 3D elevation data for the nation. Follow these guidelines to apply.
Navigate the 3DEP BAA
The 3DEP Broad Agency Announcement (BAA) facilitates partnering with the USGS and other Federal agencies to acquire high-quality 3D elevation data for the nation. Follow these guidelines to apply.

3DEP Lidar over Chicago, IL
3D Elevation Program lidar in dark blue shown over a portion of Chicago, Illinois.
3D Elevation Program Supports Broadband Internet Access.
3D Elevation Program lidar in dark blue shown over a portion of Chicago, Illinois.
3D Elevation Program Supports Broadband Internet Access.

3DEP lidar over Millsite Reservoir, UT
3DEP lidar rendering of Millsite Reservoir near Millsite State Park, Utah.
3DEP lidar rendering of Millsite Reservoir near Millsite State Park, Utah.

GeoDAWN: Geoscience Data Acquisition for Western Nevada
The USGS Earth Mapping Resources Initiative and USGS 3D Elevation Program (3DEP), Department of Energy Geothermal Technologies Office, Natural Resources Conservation Services, and Bureau of Land Management have partnered to conduct airborne geophysical and 3DEP lidar surveys over parts of Nevada and California to collect information on undiscovered geothermal, criti
The USGS Earth Mapping Resources Initiative and USGS 3D Elevation Program (3DEP), Department of Energy Geothermal Technologies Office, Natural Resources Conservation Services, and Bureau of Land Management have partnered to conduct airborne geophysical and 3DEP lidar surveys over parts of Nevada and California to collect information on undiscovered geothermal, criti

Geiger mode lidar over Chicago, IL
Geiger mode 3DEP lidar point cloud over Chicago, IL from 3DEP Project USGS Lidar Point Cloud IL 4County Cook 2017
Geiger mode 3DEP lidar point cloud over Chicago, IL from 3DEP Project USGS Lidar Point Cloud IL 4County Cook 2017

3DEP DEM Viewer Visualizations Wheeler Peak , New Mexico (NM)
The USGS 3DEP DEM viewer may be accessed at: https://apps.nationalmap.gov/3depdem
Left to right:
Aspect
The USGS 3DEP DEM viewer may be accessed at: https://apps.nationalmap.gov/3depdem
Left to right:
Aspect

3DEP Lidar Rendering of Grand Teton National Park
This is a 3DEP lidar digital rendering of Grand Teton National Park.
This is a 3DEP lidar digital rendering of Grand Teton National Park.

Cook County, IL Lidar
This is a geiger mode lidar image colored by elevation over Cook County, Illinois
This is a geiger mode lidar image colored by elevation over Cook County, Illinois

Lidar Point Cloud USGS Headquarters Reston Image Symbology
Lidar point cloud image of USGS headquarters building in Reston, VA, shaded by RGB values from orthophotos
Lidar point cloud image of USGS headquarters building in Reston, VA, shaded by RGB values from orthophotos

Lidar Point Cloud USGS Headquarters Reston Elevation Symbology
Lidar point cloud image of USGS headquarters building in Reston, VA, shaded by elevation
Lidar point cloud image of USGS headquarters building in Reston, VA, shaded by elevation

DEM Stoney Creek Area, VA
"Old Hickory" is a prospect deposit site discovered in 1988 in the Appalachian Highlands of Virginia. DEM Shows the Stoney Creek area, with 5x vertical exaggeration.
"Old Hickory" is a prospect deposit site discovered in 1988 in the Appalachian Highlands of Virginia. DEM Shows the Stoney Creek area, with 5x vertical exaggeration.

3DEP, Lidar point cloud, Pre-Hurricane Maria
Figure 2: Zooming in to red rectangle A from figure 1. Points colored by laser intensity (blue = low intensity, red = high intensity).
Figure 2: Zooming in to red rectangle A from figure 1. Points colored by laser intensity (blue = low intensity, red = high intensity).
Lidar point cloud, Pre-Hurricane PR, rotate and zoom
Figure 3: Zooming in and rotating scene in 3D from figure 2. Points coloer by laser intensity (blue = low intensity, red = high intensity).
Figure 3: Zooming in and rotating scene in 3D from figure 2. Points coloer by laser intensity (blue = low intensity, red = high intensity).

A 3DEP Image of Alaska's Denali Mountain
An oblique perspective of Alaska's Denali Mountain visualized by 3D Elevation Program lidar data.
An oblique perspective of Alaska's Denali Mountain visualized by 3D Elevation Program lidar data.