
The USGS Southwest Gravity Program carries out gravity projects for aquifer-storage monitoring and geologic modeling in California, Arizona, and New Mexico. This map shows the location of 24 projects carried out since 2010.
Multimedia
Images

Map showing current and past projects of the USGS Southwest Gravity Program
The USGS Southwest Gravity Program carries out gravity projects for aquifer-storage monitoring and geologic modeling in California, Arizona, and New Mexico. This map shows the location of 24 projects carried out since 2010.

Gravity meter sensitivity to mass change in the subsurface
As generalized in this image, a gravity measurement is sensitive to a cone-shaped region of the subsurface—as depth increases, the sensitivity to individual water molecules decreases, but the region of sensitivity expands.
As generalized in this image, a gravity measurement is sensitive to a cone-shaped region of the subsurface—as depth increases, the sensitivity to individual water molecules decreases, but the region of sensitivity expands.

Plot of dissolved solids at Colorado River below Cooper Wasteway
Line graph showing modeled continuous dissolved-solids concentration and sampled dissolved-solids concentration at station 09522005 (Colorado River below Cooper wasteway near Yuma, Arizona) and streamflow at station 09522000 (Colorado River at NIB, above Morelos Dam, Arizona) from January 2017 to March 2019.
Line graph showing modeled continuous dissolved-solids concentration and sampled dissolved-solids concentration at station 09522005 (Colorado River below Cooper wasteway near Yuma, Arizona) and streamflow at station 09522000 (Colorado River at NIB, above Morelos Dam, Arizona) from January 2017 to March 2019.

Location map of salinity monitoring locations in the Yuma area.
Map of study area and location of data collection sites in the Yuma, Arizona, area between Imperial Dam and the southerly international boundary between the United States and Mexico,
Map of study area and location of data collection sites in the Yuma, Arizona, area between Imperial Dam and the southerly international boundary between the United States and Mexico,
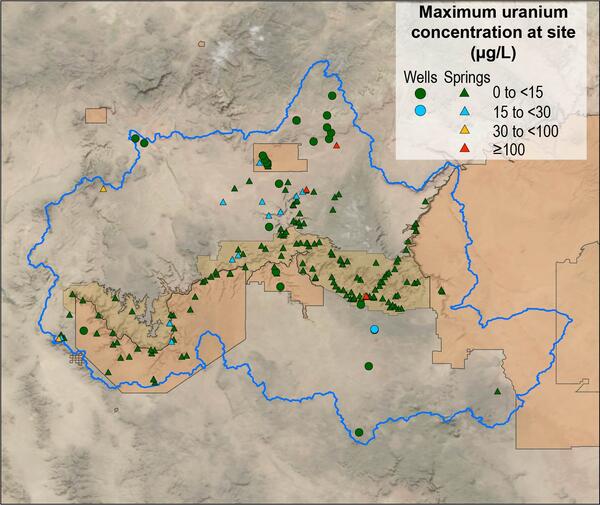
Map of Grand Canyon uranium concentrations as spring and well sites
Map of maximum uranium concentration at 206 spring and well sites in the Grand Canyon region.
Map of maximum uranium concentration at 206 spring and well sites in the Grand Canyon region.

Extensometer Well in Avra Valey, Arizona
This is an image of an extensometer well part of the Tucson Extensometer Well Network. This well is located in Avra Valley, AZ.
This is an image of an extensometer well part of the Tucson Extensometer Well Network. This well is located in Avra Valley, AZ.
Videos

Lees Ferry - 100 Years of Streamflow Monitoring
On October 1, 2021, the U.S. Geological Survey Colorado River streamflow gaging site (USGS 09380000) at Lees Ferry will mark its 100-year anniversary of recording continuous streamflow data.
On October 1, 2021, the U.S. Geological Survey Colorado River streamflow gaging site (USGS 09380000) at Lees Ferry will mark its 100-year anniversary of recording continuous streamflow data.

Colorado River: Spring Disturbance Flow
For five days in March of 2021, the Glen Canyon Dam released a historically low flow of 4,000 cubic feet per second into the Colorado River.
For five days in March of 2021, the Glen Canyon Dam released a historically low flow of 4,000 cubic feet per second into the Colorado River.

B-Roll of Lees Ferry
A collection of video for use in products related to the USGS's streamgage at Lees Ferry. The USGS installed the Lees Ferry gauge 100 years ago, and the data collected since have become critical to monitoring water availability in the West.
Shot List:
A collection of video for use in products related to the USGS's streamgage at Lees Ferry. The USGS installed the Lees Ferry gauge 100 years ago, and the data collected since have become critical to monitoring water availability in the West.
Shot List:

A partnership to protect critical infrastructure
This video is an introduction to the partnership between the USGS Arizona Water Science Center and the Arizona Department of Transportation, or ADOT, as it is referred to throughout the video. These two agencies are working together, using cutting edge technology and methods, to understand how flood flows interact with and impact critical infrastructure.
This video is an introduction to the partnership between the USGS Arizona Water Science Center and the Arizona Department of Transportation, or ADOT, as it is referred to throughout the video. These two agencies are working together, using cutting edge technology and methods, to understand how flood flows interact with and impact critical infrastructure.
")
A partnership to protect critical infrastructure (Audio-Described)
This video is an introduction to the partnership between the USGS Arizona Water Science Center and the Arizona Department of Transportation, or ADOT, as it is referred to throughout the video. These two agencies are working together, using cutting edge technology and methods, to understand how flood flows interact with and impact critical infrastructure.
This video is an introduction to the partnership between the USGS Arizona Water Science Center and the Arizona Department of Transportation, or ADOT, as it is referred to throughout the video. These two agencies are working together, using cutting edge technology and methods, to understand how flood flows interact with and impact critical infrastructure.
")
A USGS guide for finding and interpreting high-water marks (AD)
High-water marks provide valuable data for understanding recent and historical flood events. The proper collection and recording of high-water mark data from perishable and preserved evidence informs flood assessments, research, and water resource management.
High-water marks provide valuable data for understanding recent and historical flood events. The proper collection and recording of high-water mark data from perishable and preserved evidence informs flood assessments, research, and water resource management.