
A Landsat Surface Reflectance (SR) Normalized Difference Index (NDVI) map of the San Joaquin Valley region of California on March 10, 2022.
Images
With 50 years of satellite observations to draw from, the Landsat Archive has no shortage of beautiful and informative imagery to share. Peruse some of the best below.
Filter Total Items: 85
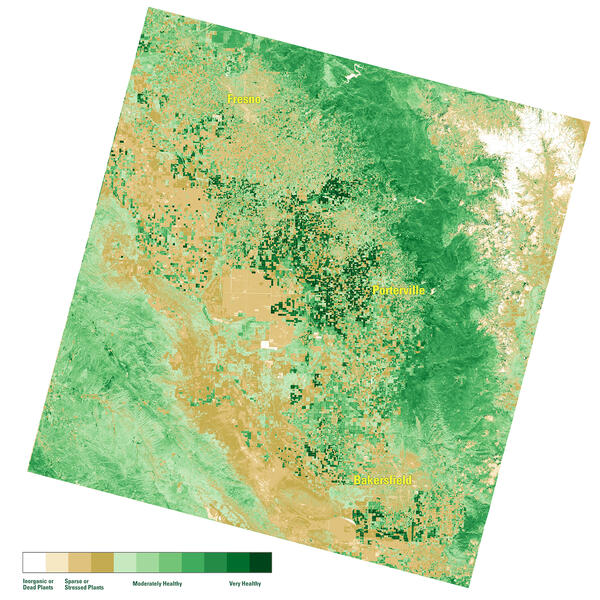
NDVI map of the San Joaquin Valley Region, March 10, 2022
A Landsat Surface Reflectance (SR) Normalized Difference Index (NDVI) map of the San Joaquin Valley region of California on March 10, 2022.

Landsat 9 image of Bangladesh Coast
Landsat 9 natural color image (Bands 4, 3, 2) of the Bangladesh coastline on the Bay of Bengal acquired on February 8, 2022. The Sundarbans mangrove forest, a protected UNESCO area, appears as dark green on the left side of the image. The right side of the image shows agricultural lands and urban areas as light tan and gray.
Landsat 9 natural color image (Bands 4, 3, 2) of the Bangladesh coastline on the Bay of Bengal acquired on February 8, 2022. The Sundarbans mangrove forest, a protected UNESCO area, appears as dark green on the left side of the image. The right side of the image shows agricultural lands and urban areas as light tan and gray.

Landsat 9 image of San Francisco Bay, California
This natural color Landsat 9 image from December 10, 2021 shows the cities of San Francisco, San Jose, and Oakland surrounding the San Francisco Bay. The bay is the largest estuary on the west coast and includes a patchwork of mud flats, salt marshes, and salt ponds.
This natural color Landsat 9 image from December 10, 2021 shows the cities of San Francisco, San Jose, and Oakland surrounding the San Francisco Bay. The bay is the largest estuary on the west coast and includes a patchwork of mud flats, salt marshes, and salt ponds.

Landsat 9 Image of Western Guinea-Bissau
The Geba River on the west coast of Guinea-Bissau is seen in this natural color Landsat 9 image from February 8, 2022. Silt carried by the river into the Atlantic Ocean creates intricate patterns as it moves around the Bissagos (or Bijagós) Islands. The country’s capital, Bissau, can be seen on the north side of the estuary and appears as light brown.
The Geba River on the west coast of Guinea-Bissau is seen in this natural color Landsat 9 image from February 8, 2022. Silt carried by the river into the Atlantic Ocean creates intricate patterns as it moves around the Bissagos (or Bijagós) Islands. The country’s capital, Bissau, can be seen on the north side of the estuary and appears as light brown.

Landsat 9 image of Abaco Island, The Bahamas
Natural color image of Abacco Islands, the Bahamas, as seen by Landsat 9 on January 18, 2022. Between Landsat 8 and Landsat 9, the Landsat program delivers complete coverage of the Earth’s surface every eight days.
Landsat Scene ID LC09_L1TP_013042_20220118_20220118_02_T1
Natural color image of Abacco Islands, the Bahamas, as seen by Landsat 9 on January 18, 2022. Between Landsat 8 and Landsat 9, the Landsat program delivers complete coverage of the Earth’s surface every eight days.
Landsat Scene ID LC09_L1TP_013042_20220118_20220118_02_T1

LIMA Image
In the International Polar Year 2007-2008, Landsat 7 brought the coldest continent to life with high resolution satellite imagery.
In the International Polar Year 2007-2008, Landsat 7 brought the coldest continent to life with high resolution satellite imagery.

10 Millionth Landsat Image
On November 23, 2021, the Landsat Archive added its ten millionth image. The Landsat 7 scene was acquired over the Dead Sea and is shown as a false color image using the short-wave infrared, near infrared and red bands (bands 5,4,3).
On November 23, 2021, the Landsat Archive added its ten millionth image. The Landsat 7 scene was acquired over the Dead Sea and is shown as a false color image using the short-wave infrared, near infrared and red bands (bands 5,4,3).

Navajo Nation
In the Western U.S., in places like the Navajo Nation as seen in this Landsat 9 image, Landsat and other satellite data help people monitor drought conditions and manage irrigation water. With only 85 rain gauges to cover more than 27,000 square miles, satellite data and climate models are filling the gaps to help the Navajo Nation monitor drought severity.
In the Western U.S., in places like the Navajo Nation as seen in this Landsat 9 image, Landsat and other satellite data help people monitor drought conditions and manage irrigation water. With only 85 rain gauges to cover more than 27,000 square miles, satellite data and climate models are filling the gaps to help the Navajo Nation monitor drought severity.

Landsat 9 First Light Image of the Himalayas
The city of Kathmandu, Nepal, seen at the bottom left of this Landsat 9 image, lies in a valley south of the Himalayan Mountainsbetween Nepal and China. Glaciers, and the lakes formed by glacial meltwater, are visible in the top middle of this image.
The city of Kathmandu, Nepal, seen at the bottom left of this Landsat 9 image, lies in a valley south of the Himalayan Mountainsbetween Nepal and China. Glaciers, and the lakes formed by glacial meltwater, are visible in the top middle of this image.

Landsat 8 Collection 2 image of the Menindee Lakes in Australia
The Menindee Lakes in the Far West of New South Wales, Australia, are seen in this Landsat 8 Collection 2 image from May 14, 2021, and is shown as a natural color composite using the red, green, and blue bands (Bands 4,3,2).
The Menindee Lakes in the Far West of New South Wales, Australia, are seen in this Landsat 8 Collection 2 image from May 14, 2021, and is shown as a natural color composite using the red, green, and blue bands (Bands 4,3,2).

Landsat 8 Collection 2 image of the Richat Structure
This Landsat 8 Collection 2 image was acquired over the Richat Structure near the western edge of the Sahara Desert on April 25, 2020 and is shown as a natural color composite using the red, green, and blue bands (Bands 4,3,2).
This Landsat 8 Collection 2 image was acquired over the Richat Structure near the western edge of the Sahara Desert on April 25, 2020 and is shown as a natural color composite using the red, green, and blue bands (Bands 4,3,2).

Landsat 8 Image of Lake St. Clair
Landsat captured the tug of war between winter and spring on the heart-shaped Lake St. Clair along the U.S./Canadian border near Detroit.
This Landsat 8 image was acquired on March 6, 2021 and is shown as a natural color composite.
Learn more about the Landsat program at www.usgs.gov/landsat
Landsat captured the tug of war between winter and spring on the heart-shaped Lake St. Clair along the U.S./Canadian border near Detroit.
This Landsat 8 image was acquired on March 6, 2021 and is shown as a natural color composite.
Learn more about the Landsat program at www.usgs.gov/landsat

Landsat 8 image showing southwest Morocco
Landsat 8 image acquired on November 11, 2020 over southwest Morocco (Path 203 Row 40). The image is shown using the shortwave infrared 2, red, and blue bands (bands 7,4,2).
Landsat Scene ID LO08_L1TP_203040_20201107_20201111_01_T1
Landsat 8 image acquired on November 11, 2020 over southwest Morocco (Path 203 Row 40). The image is shown using the shortwave infrared 2, red, and blue bands (bands 7,4,2).
Landsat Scene ID LO08_L1TP_203040_20201107_20201111_01_T1

Landsat 8 image showing Lakes Everard and Harry in S. Australia
Example of the Landsat 8 OLI/TIRS Collection 2 level-1 product. This Landsat 8 image was acquired on August 18, 2020 over Lake Everard and Lake Harry in southern Australia and is shown as a false color composite using the shortwave infrared, near infrared, and red bands (bands 6,5,4).
Example of the Landsat 8 OLI/TIRS Collection 2 level-1 product. This Landsat 8 image was acquired on August 18, 2020 over Lake Everard and Lake Harry in southern Australia and is shown as a false color composite using the shortwave infrared, near infrared, and red bands (bands 6,5,4).


Nighttime Landsat 8 image of the Taal Volcano
This image shows a false color (bands 7,6,5) nighttime Landsat 8 image of the Taal Volcano overlaid on a daytime Landsat panchromatic black and white image (band 8). The nighttime image from path 220/row194 was acquired on January 15, 2020, a few days after the volcano's eruption.
This image shows a false color (bands 7,6,5) nighttime Landsat 8 image of the Taal Volcano overlaid on a daytime Landsat panchromatic black and white image (band 8). The nighttime image from path 220/row194 was acquired on January 15, 2020, a few days after the volcano's eruption.

A 50-Year Flooding Flashback
The high-water marks set by the Big Sioux River in cities across southeastern South Dakota have threatened to overtake records set 50 years ago, when the Army Corps of Engineers led missions to document the damage through hundreds of aerial photographs.
The high-water marks set by the Big Sioux River in cities across southeastern South Dakota have threatened to overtake records set 50 years ago, when the Army Corps of Engineers led missions to document the damage through hundreds of aerial photographs.

Landsat 8 image of the Apostle Islands in Lake Superior
Citation: Citation_Information: Originator: U.S.
Citation: Citation_Information: Originator: U.S.

Burning Man's Temporary City
Burning Man is named for the wooden effigy set ablaze at the end of the weeklong celebration in the temporary metropolis of Black Rock City.
Burning Man is named for the wooden effigy set ablaze at the end of the weeklong celebration in the temporary metropolis of Black Rock City.

Mendocino Complex Fire Scorches Northern California
Landsat 8 captured satellite views of California's largest wildfire on record in the summer of 2018. The Mendocino Complex fire in northern California is a combination of two fires: the Ranch Fire and the River Fire.
Landsat 8 captured satellite views of California's largest wildfire on record in the summer of 2018. The Mendocino Complex fire in northern California is a combination of two fires: the Ranch Fire and the River Fire.

8 Million Landsat Scenes
The Landsat archive has added its 8 millionth scene. This stunning image was captured by Landsat 8 on July 28, 2018. It shows the coastline of Nordaustlandet, the second-largest island in Norway’s Svalbard archipelago.
The Landsat archive has added its 8 millionth scene. This stunning image was captured by Landsat 8 on July 28, 2018. It shows the coastline of Nordaustlandet, the second-largest island in Norway’s Svalbard archipelago.