
Example of the Landsat Collection 2 Fractional Snow Covered Area (fSCA) Science Product showing an area in the Dixie National Forest in Utah on February 28, 2021 for tile h007V010. Left: Landsat Collection 2 U.S. Analysis Ready Data Surface Reflectance image, Middle: fSCA, and Right: Canopy Adjusted fSCA.
Images
Explore USGS Landsat Program images.
Filter Total Items: 309

Example of the Landsat Collection 2 Fractional Snow Covered Snow Science Product
Example of the Landsat Collection 2 Fractional Snow Covered Area (fSCA) Science Product showing an area in the Dixie National Forest in Utah on February 28, 2021 for tile h007V010. Left: Landsat Collection 2 U.S. Analysis Ready Data Surface Reflectance image, Middle: fSCA, and Right: Canopy Adjusted fSCA.

Landsat 5 image of Gascoyne, Australia
Landsat 5 image of Gascoyne, West Australia. The image was acquired on December 12, 2010.
Learn more about Landsat at www.usgs.gov/landsat
Landsat 5 image of Gascoyne, West Australia. The image was acquired on December 12, 2010.
Learn more about Landsat at www.usgs.gov/landsat

Example of Landsat Collection 2 Surface Temperature
Example of Landsat Collection 2 Surface Temperature over the Tacoma, Washington area. Landsat 5 image aquired on October 6, 2010.
Example of Landsat Collection 2 Surface Temperature over the Tacoma, Washington area. Landsat 5 image aquired on October 6, 2010.

Landsat Collection 2 Sample Data Example
Landsat 5 Thematic Mapper (TM) Collection 2 sample data example
Bands 5,4,3
Landsat 5 Thematic Mapper (TM) Collection 2 sample data example
Bands 5,4,3

Landsat 5 image showing the Seattle, Washington area
Example of the Landsat 4-5 TM Collection 2 level-1 product. This Landsat 5 image was acquired on October 6, 2010 near Seattle, Washington and is shown as a natural color composite using the red, green, and blue bands (bands 3,2,1).
Example of the Landsat 4-5 TM Collection 2 level-1 product. This Landsat 5 image was acquired on October 6, 2010 near Seattle, Washington and is shown as a natural color composite using the red, green, and blue bands (bands 3,2,1).

Example of the Landsat 4-5 TM Collection 2 level-2 science products
Example of the Landsat 4-5 TM Collection 2 level-2 science products. Left: Landsat 5 level-2 surface reflectance image. Right: Landsat 5 level-2 surface temperature image. The data was acquired on October 6, 2010 (path 47 row 27).
Example of the Landsat 4-5 TM Collection 2 level-2 science products. Left: Landsat 5 level-2 surface reflectance image. Right: Landsat 5 level-2 surface temperature image. The data was acquired on October 6, 2010 (path 47 row 27).

Example of the Landsat Collection 2 Surface Reflectance product
Example of the Landsat Collection 2 Level-2 Surface Reflectance science product over Seattle, Washington. Landsat 5 image acquired Oct 6, 2010 (bands 4,3,2)
Example of the Landsat Collection 2 Level-2 Surface Reflectance science product over Seattle, Washington. Landsat 5 image acquired Oct 6, 2010 (bands 4,3,2)

Example of Landsat 5 Collection 2
Example of Landsat 5 Collection 2 data over Bremerton, WA. acquired on October 6, 2010. Left: Level 1 data, middle: Level-2 surface reflectance, right: Level-2 surface temperature.
Example of Landsat 5 Collection 2 data over Bremerton, WA. acquired on October 6, 2010. Left: Level 1 data, middle: Level-2 surface reflectance, right: Level-2 surface temperature.

Sheridan Glacier from the Air
Sheridan glacier and Sheridan river from the air, rich in fine glacial flour.
Sheridan glacier and Sheridan river from the air, rich in fine glacial flour.

Farmland near Hydetown, PA
Farmland near Hydetown, Pennsylvania, part of the Erie Drift Plain Ecoregion. This photo was taken during fieldwork for the USGS Land Cover Trends project. The project was focused on understanding the rates, trends, causes, and consequences of contemporary U.S.
Farmland near Hydetown, Pennsylvania, part of the Erie Drift Plain Ecoregion. This photo was taken during fieldwork for the USGS Land Cover Trends project. The project was focused on understanding the rates, trends, causes, and consequences of contemporary U.S.

Landsat 7 image showing the area near Ciudad Obregón, Mexico
Example of the Landsat 7 ETM+ Collection 2 level-1 product. This Landsat 7 image was acquired on January 1, 2003 near Ciudad Obregón, Mexico and is shown as a natural color composite using the red, green, and blue bands (bands 3,2,1).
Example of the Landsat 7 ETM+ Collection 2 level-1 product. This Landsat 7 image was acquired on January 1, 2003 near Ciudad Obregón, Mexico and is shown as a natural color composite using the red, green, and blue bands (bands 3,2,1).

Comparison of Landsat 5 and Landsat 7 Thermal Resolution Near Alliance, Nebraska
This graphic highlights the difference in thermal band resolution between Landsat 5 and Landsat 7, focusing on center pivot irrigation fields near Alliance, Nebraska. The Landsat 5 image (top), taken on July 3, 2002, has a coarser 120-meter resolution, while the Landsat 7 image (bottom), from July 2, 2002, offers greater detail with its 60-meter resolution.
This graphic highlights the difference in thermal band resolution between Landsat 5 and Landsat 7, focusing on center pivot irrigation fields near Alliance, Nebraska. The Landsat 5 image (top), taken on July 3, 2002, has a coarser 120-meter resolution, while the Landsat 7 image (bottom), from July 2, 2002, offers greater detail with its 60-meter resolution.

Center-pivot irrigation in Saudi Arabia captured by Landsat 7, 2000
Landsat 7 captured this image of center-pivot irrigation (green circles) in the Saudi Arabian desert in 2000. Images taken of the same location over several decades show the explosive increase of irrigated land over time, as hidden reserves of water have been tapped beneath desert sands to grow grains, fruits, and vegetables.
Landsat 7 captured this image of center-pivot irrigation (green circles) in the Saudi Arabian desert in 2000. Images taken of the same location over several decades show the explosive increase of irrigated land over time, as hidden reserves of water have been tapped beneath desert sands to grow grains, fruits, and vegetables.

Landsat Image Mosaic Of Antarctica (LIMA) Mosaic
Landsat 7 imagery was used to create a full continent mosaic of Antarctica.
Landsat 7 imagery was used to create a full continent mosaic of Antarctica.

1999 Landsat 7 Launch
Landsat 7 was successfully launched on April 15, 1999, from the Western Test Range of Vandenberg Air Force Base, California, on a Delta II expendable launch vehicle. EROS History Project
Landsat 7 was successfully launched on April 15, 1999, from the Western Test Range of Vandenberg Air Force Base, California, on a Delta II expendable launch vehicle. EROS History Project

Landsat 7 Sees Coral Reefs around Upolu Island Samoa
Landsat 7 captured this image of Upolu Island in Samoa in July of 1999. The coral reefs around Upolu and surrounding islands have been studied for longevity. Coral reefs around the island are virtually continuous, forming an extensive shallow reef flat. Landsat 7 July 6, 1999.
Landsat 7 captured this image of Upolu Island in Samoa in July of 1999. The coral reefs around Upolu and surrounding islands have been studied for longevity. Coral reefs around the island are virtually continuous, forming an extensive shallow reef flat. Landsat 7 July 6, 1999.
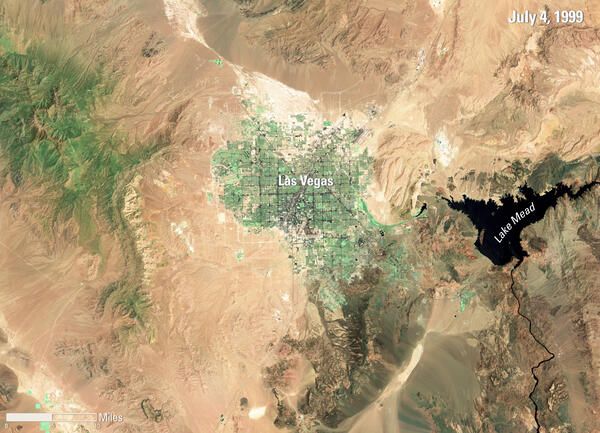
Las Vegas, 1999
This Landsat 7 image of the Las Vegas area, acquired on July 4, 1999, is the first image captured of this region by the satellite. The image prominently features the city of Las Vegas. It also shows Lake Mead, the largest reservoir in the United States, along with the surrounding desert landscape.
This Landsat 7 image of the Las Vegas area, acquired on July 4, 1999, is the first image captured of this region by the satellite. The image prominently features the city of Las Vegas. It also shows Lake Mead, the largest reservoir in the United States, along with the surrounding desert landscape.

Landsat 7 Underfly Image with Landsat 5
Landsat 7 underfly with Landsat 5 over the Niobrara River, Nebraska on June 2, 1999. The left image shows the Landsat 5 TM image and the right image is from Landsat 7 ETM+. Both images are shown as a false color image using the near infrared, red, and green bands (Bands 4|3|2).
Landsat 7 underfly with Landsat 5 over the Niobrara River, Nebraska on June 2, 1999. The left image shows the Landsat 5 TM image and the right image is from Landsat 7 ETM+. Both images are shown as a false color image using the near infrared, red, and green bands (Bands 4|3|2).

First Landsat 7 image of Sioux Falls, South Dakota
This pan sharpened color infrared image of Sioux Falls, South Dakota is from the first scene acquired by Landsat 7's Enhanced Thematic Mapper Plus (ETM+) sensor on April 18, 1999. The image is shown using the near infrared, red, and green bands (Bands 4,3,2).
This pan sharpened color infrared image of Sioux Falls, South Dakota is from the first scene acquired by Landsat 7's Enhanced Thematic Mapper Plus (ETM+) sensor on April 18, 1999. The image is shown using the near infrared, red, and green bands (Bands 4,3,2).

Landsat 5 Image of the Great Salt Lake in July, 1986
Natural color Landsat 5 image of the Great Salt Lake acquired on July 1, 1986. In 1986, the lake was at a record high and covered approximately 2,300 square miles and contained 30 million acre-feet of water (an acre-foot is the amount of water necessary to cover 1 acre of land with water 1 foot in depth or about 326,000 gallons).
Natural color Landsat 5 image of the Great Salt Lake acquired on July 1, 1986. In 1986, the lake was at a record high and covered approximately 2,300 square miles and contained 30 million acre-feet of water (an acre-foot is the amount of water necessary to cover 1 acre of land with water 1 foot in depth or about 326,000 gallons).

Landsat 5 Underfly with Landsat 4 over Huntsville, Alabama
Showing images acquired over Huntsville, Alabama during the Landsat 5 underfly with Landsat 4. On the top is the Landsat 4 TM image, and on the bottom is the Landsat 5 TM image. Both image composites are shown as a natural color composite using the red, green, and blue bands (Bands 3|2|1)
Showing images acquired over Huntsville, Alabama during the Landsat 5 underfly with Landsat 4. On the top is the Landsat 4 TM image, and on the bottom is the Landsat 5 TM image. Both image composites are shown as a natural color composite using the red, green, and blue bands (Bands 3|2|1)