
Mudpot located in the Mud Volcano thermal area of Yellowstone National Park. This type of thermal feature indicates an acid-sulfate system.
Images
Images related to Yellowstone Volcano Observatory.
Filter Total Items: 528

Mudpot located near Mud Volcano in Yellowstone National Park
Mudpot located in the Mud Volcano thermal area of Yellowstone National Park. This type of thermal feature indicates an acid-sulfate system.

Steam vents along the Yellowstone River near Mud Volcano thermal area
Steam vents along the Yellowstone River near Mud Volcano thermal area, Yellowstone National Park.
Steam vents along the Yellowstone River near Mud Volcano thermal area, Yellowstone National Park.

Thermal anomaly map of Yellowstone National Park based on a Landsat 8 nighttime thermal infrared image from 9 January 2021
linkThermal anomaly map of Yellowstone National Park, based on a Landsat 8 nighttime thermal infrared image from 9 January 2021. The color ramp indicates the intensity of the above-background thermal anomaly for each thermal area. Lakes are blue. Yellowstone caldera and resurgent domes are outlined in black.

Columbia River Basalts seen at Steens Mountain, Oregon
Looking southwest from the Steens Mountain summit area into the Alvord desert of eastern Oregon. This fault-block escarpment reveals the oldest lava flows of the Columbia River Flood Basalts, which erupted about 17 million years ago. Three or four vertical dikes that feed these flows are evident in the midground ridge where they stand as rock walls cutti
Looking southwest from the Steens Mountain summit area into the Alvord desert of eastern Oregon. This fault-block escarpment reveals the oldest lava flows of the Columbia River Flood Basalts, which erupted about 17 million years ago. Three or four vertical dikes that feed these flows are evident in the midground ridge where they stand as rock walls cutti
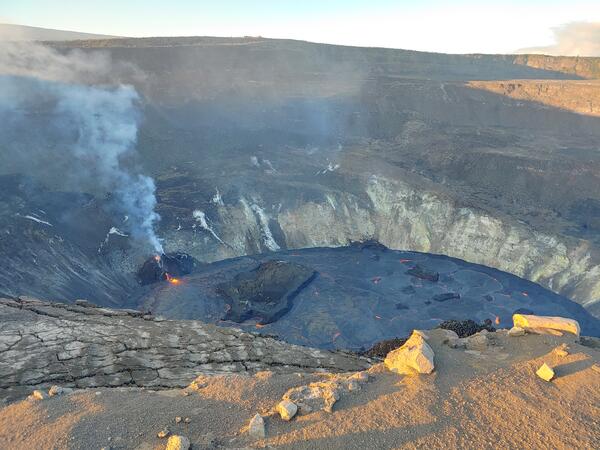
Halema‘uma‘u lava lake on the evening of 5 January, 2021
View looking north across Kīlauea caldera from the south rim of Halema‘uma‘u, showing the ongoing eruption around 5:30 p.m. HST on January 5, 2021. The west vent activity included the “dome fountain,” effusive lava flows from a mid-elevation vent, and weak strombolian spattering activity from the high-elevation vent. USGS photo by K. Lynn.
View looking north across Kīlauea caldera from the south rim of Halema‘uma‘u, showing the ongoing eruption around 5:30 p.m. HST on January 5, 2021. The west vent activity included the “dome fountain,” effusive lava flows from a mid-elevation vent, and weak strombolian spattering activity from the high-elevation vent. USGS photo by K. Lynn.

Halema‘uma‘u west vent activity for the evening of 5 January, 2021
Telephoto view of the lava flow and “dome fountain” activity at the west vent of the ongoing eruption in Halema‘uma‘u, Kīlauea Volcano summit, at 5:45 p.m. HST on 5 January, 2021. USGS photo by K. Lynn.
Telephoto view of the lava flow and “dome fountain” activity at the west vent of the ongoing eruption in Halema‘uma‘u, Kīlauea Volcano summit, at 5:45 p.m. HST on 5 January, 2021. USGS photo by K. Lynn.

Eruptions of Steamboat Geyser over time
Eruptions of Steamboat Geyser over time. (A) Cumulative eruptions of Steamboat Geyser since 1960. Each dot represents an eruption. (B) Comparative plot of the cumulative eruptions in each active phase (1960s, 1980s, and 2018-). Data from GeyserTimes.
Eruptions of Steamboat Geyser over time. (A) Cumulative eruptions of Steamboat Geyser since 1960. Each dot represents an eruption. (B) Comparative plot of the cumulative eruptions in each active phase (1960s, 1980s, and 2018-). Data from GeyserTimes.

Steamboat Geyser eruption signals
Steamboat Geyser eruption signals recorded by nearby monitoring instruments. The vertical pink lines mark when the signal first appears. (A) Seismic station YNM records a signal which slowly tapers as the eruption decreases in intensity. Spikes seen before the eruption are mostly due to human activity.
Steamboat Geyser eruption signals recorded by nearby monitoring instruments. The vertical pink lines mark when the signal first appears. (A) Seismic station YNM records a signal which slowly tapers as the eruption decreases in intensity. Spikes seen before the eruption are mostly due to human activity.

Map of seismicity in the Yellowstone region during 2020
Map of seismicity (red circles) in the Yellowstone region during 2020. Gray lines are roads, red line shows the caldera boundary, Yellowstone National Park is outlined by black dashed line, and gray dashed lines denote state boundaries.
Map of seismicity (red circles) in the Yellowstone region during 2020. Gray lines are roads, red line shows the caldera boundary, Yellowstone National Park is outlined by black dashed line, and gray dashed lines denote state boundaries.

Structural map of the onset of the Yellowstone-Snake River Plain hotspot track
Beginning of Yellowstone-Snake River Plain hotspot track and resulting northeasterly path of the ancestral Missouri River starting about 16.5 million years ago. Modified from Hyndman D.W., and Thomas, R.C., 2020, Roadside Geology of Montana, Mountain Press Publishing, 464 p.
Beginning of Yellowstone-Snake River Plain hotspot track and resulting northeasterly path of the ancestral Missouri River starting about 16.5 million years ago. Modified from Hyndman D.W., and Thomas, R.C., 2020, Roadside Geology of Montana, Mountain Press Publishing, 464 p.

Section from the piston core YL92-1C, collected in south-central Yellowstone Lake
Section from the piston core YL92-1C, collected in south-central Yellowstone Lake. The core is viewed horizontally, with the top of core to the left. The core section shown is from 5.21–5.63 meters (17–18.4 feet) depth.
Section from the piston core YL92-1C, collected in south-central Yellowstone Lake. The core is viewed horizontally, with the top of core to the left. The core section shown is from 5.21–5.63 meters (17–18.4 feet) depth.

Satellite view of Ngorongoro volcano, in Tanzania, east Africa
Ngorongoro volcano, in Tanzania, east Africa, is a caldera that formed 2-3 million years ago. The Ngorongoro Conservation Area is a UNESCO World Heritage Site and home to one of the densest concentrations of wildlife in Africa. Satellite Image from CNES/Airbus via Google Earth.
Ngorongoro volcano, in Tanzania, east Africa, is a caldera that formed 2-3 million years ago. The Ngorongoro Conservation Area is a UNESCO World Heritage Site and home to one of the densest concentrations of wildlife in Africa. Satellite Image from CNES/Airbus via Google Earth.

Absolute versus relative earthquake locations associated with 2019 Ridgecrest, California, foreshock and aftershock sequence
linkAbsolute versus relative earthquake locations associated with 2019 Ridgecrest, California, foreshock and aftershock sequence. Animated GIF image compares the routine catalog earthquake locations with those from an enhanced catalog employing precise relative locations. Depths are color-coded as shown. Triangles indicate seismic stations.

Determining the height of a geyser eruption with trigonometry
Yellowstone rangers -- and tourists, too! -- can determine the height of a geyser eruption with some simple trigonometry.
Yellowstone rangers -- and tourists, too! -- can determine the height of a geyser eruption with some simple trigonometry.

Experimental apparatus for reacting hot water and rhyolite
Experimental apparatus for reacting hot water and rhyolite. The photo on the left shows the inert gold bags into which the rhyolite fragments and water were inserted. After being sealed, the gold bag is then placed into a steel pressure vessel, which itself is loaded into a furnace (photo on the right).
Experimental apparatus for reacting hot water and rhyolite. The photo on the left shows the inert gold bags into which the rhyolite fragments and water were inserted. After being sealed, the gold bag is then placed into a steel pressure vessel, which itself is loaded into a furnace (photo on the right).

Swath bathymetric image of the Elliott’s Crater explosion crater
Swath bathymetric image of the Elliott’s Crater explosion crater in Yellowstone Lake. Inset shows location of the crater and the swath image (red box) within the northern part of the lake.
Swath bathymetric image of the Elliott’s Crater explosion crater in Yellowstone Lake. Inset shows location of the crater and the swath image (red box) within the northern part of the lake.

Scanning electron microscope image of Yellowstone drill core
The right side of the figure is an image of a small piece of the Y-9 core from the USGS 1967-68 drilling expedition to Yellowstone National Park. The black area was analyzed using a scanning electron microscope (SEM) at the University of Wyoming to determine mineralogy and dispersion of elements.
The right side of the figure is an image of a small piece of the Y-9 core from the USGS 1967-68 drilling expedition to Yellowstone National Park. The black area was analyzed using a scanning electron microscope (SEM) at the University of Wyoming to determine mineralogy and dispersion of elements.

Research drilling in Yellowstone National Park
Research drilling in Yellowstone National Park. (A) is an image from Fenner (1936) of the drilling setup in the Upper Geyser Basin during the 1929 field season. (B) is an image from White et al. (1975) of the USGS drill rig set up in the Norris Geyser Basin in 1967-68 during a steam eruption.
Research drilling in Yellowstone National Park. (A) is an image from Fenner (1936) of the drilling setup in the Upper Geyser Basin during the 1929 field season. (B) is an image from White et al. (1975) of the USGS drill rig set up in the Norris Geyser Basin in 1967-68 during a steam eruption.

Seismicity rates for Yellowstone Lake earthquake swarms
Rate of earthquake occurrence for the 2008-2009 Yellowstone Lake swarm (green) and 2020 swarm (red).
Rate of earthquake occurrence for the 2008-2009 Yellowstone Lake swarm (green) and 2020 swarm (red).

Map of Yellowstone Lake seismic swarms in 2008-2009 and 2020
Map of earthquakes that occurred beneath Yellowstone Lake as parts of seismic swarms in 2008-2009 (green) and 2020 (red). Orange line is the boundary of Yellowstone Caldera, which formed 631,000 years ago.
Map of earthquakes that occurred beneath Yellowstone Lake as parts of seismic swarms in 2008-2009 (green) and 2020 (red). Orange line is the boundary of Yellowstone Caldera, which formed 631,000 years ago.

Volcanic rocks in SE Idaho that are related to the Yellowstone hotspot
Map of southeastern Idaho showing volcanic rocks related to the Yellowstone hotspot. Basalt is shown in red and rhyolite in yellow. Blue circles indicate the location of past Yellowstone calderas; caldera names and approximate ages are shown (Ma = million years old).
Map of southeastern Idaho showing volcanic rocks related to the Yellowstone hotspot. Basalt is shown in red and rhyolite in yellow. Blue circles indicate the location of past Yellowstone calderas; caldera names and approximate ages are shown (Ma = million years old).