
Near vertical (top, middle) and low angle oblique (bottom) aerial photographs of Salvo, North Carolina. View looking west along the North Carolina shore. Waves and surge from Hurricane Joaquin eroded the beach, causing significant shoreline retreat and a narrower beach, leaving deposits of darker sand at the base of the dune (green arrow).
Images
Images intro.
Filter Total Items: 2135

Aerial photographs of Salvo, North Carolina
Near vertical (top, middle) and low angle oblique (bottom) aerial photographs of Salvo, North Carolina. View looking west along the North Carolina shore. Waves and surge from Hurricane Joaquin eroded the beach, causing significant shoreline retreat and a narrower beach, leaving deposits of darker sand at the base of the dune (green arrow).

Aerial photographs of Hatteras, North Carolina
Near vertical (top, middle) and low angle oblique (bottom) aerial photographs of Hatteras, North Carolina. View looking north along the North Carolina shore. Waves and surge from Hurricane Joaquin eroded the beach, causing significant shoreline retreat and a narrower beach at the location of the Hurricane Isabel breach in 2003 (green arrow).
Near vertical (top, middle) and low angle oblique (bottom) aerial photographs of Hatteras, North Carolina. View looking north along the North Carolina shore. Waves and surge from Hurricane Joaquin eroded the beach, causing significant shoreline retreat and a narrower beach at the location of the Hurricane Isabel breach in 2003 (green arrow).

Aerial photographs of New Drum Inlet, Core Banks, North Carolina
Near vertical (top, middle) and low angle oblique (bottom) aerial photographs of New Drum Inlet, Core Banks, North Carolina. View looking northwest along the North Carolina shore.
Near vertical (top, middle) and low angle oblique (bottom) aerial photographs of New Drum Inlet, Core Banks, North Carolina. View looking northwest along the North Carolina shore.

Aerial photographs of Bear Inlet, North Carolina
Near vertical (top, middle) and low angle oblique (bottom) aerial photographs of Bear Inlet, North Carolina. View looking northwest along the North Carolina shore. High waves and storm surge from Hurricane Joaquin eroded the beaches, moving sand inland (green arrow) and reshaping the flood-tidal shoals.
Near vertical (top, middle) and low angle oblique (bottom) aerial photographs of Bear Inlet, North Carolina. View looking northwest along the North Carolina shore. High waves and storm surge from Hurricane Joaquin eroded the beaches, moving sand inland (green arrow) and reshaping the flood-tidal shoals.

Aerial photographs of Camp Lejeune, North Carolina
Near vertical (top, middle) and low angle oblique (bottom) aerial photographs of Camp Lejeune, North Carolina. View looking northwest along the North Carolina shore. Waves and surge from Hurricane Joaquin eroded the beach, causing significant shoreline retreat and a narrower beach.
Near vertical (top, middle) and low angle oblique (bottom) aerial photographs of Camp Lejeune, North Carolina. View looking northwest along the North Carolina shore. Waves and surge from Hurricane Joaquin eroded the beach, causing significant shoreline retreat and a narrower beach.

Aerial photographs of Topsail, North Carolina
Near vertical (top, middle) and low angle oblique (bottom) aerial photographs of Topsail, North Carolina. View looking northwest along the North Carolina shore. Elevated storm-induced water levels overtopped the low dunes here causing the dune to overwash. Sand was transported landward, burying the marsh (green arrow).
Near vertical (top, middle) and low angle oblique (bottom) aerial photographs of Topsail, North Carolina. View looking northwest along the North Carolina shore. Elevated storm-induced water levels overtopped the low dunes here causing the dune to overwash. Sand was transported landward, burying the marsh (green arrow).

Woods Hole Coastal and Marine Science Center
Woods Hole Coastal and Marine Science Center side entrance to the Tilley Conference Room
Woods Hole Coastal and Marine Science Center side entrance to the Tilley Conference Room

Lights! Camera! Action!
Dr. Laura Brothers preparing to collect visual imagery aboard the RV Rafael as part of the launch of the MiniSEABOSS while doing work off of Nantucket. The MiniSEABOSS collects samples, photos and video of the seafloor.
Dr. Laura Brothers preparing to collect visual imagery aboard the RV Rafael as part of the launch of the MiniSEABOSS while doing work off of Nantucket. The MiniSEABOSS collects samples, photos and video of the seafloor.

Special Delivery
Sandy Brosnahan transporting a weather buoy into the Woods Hole Coastal and Marine Science Center’s operational facility in preparation for deployment. This buoy was one of 6 deployed to measure wind speed, direction, pressure, and temperature off the coast of Fire Island, NY.
Sandy Brosnahan transporting a weather buoy into the Woods Hole Coastal and Marine Science Center’s operational facility in preparation for deployment. This buoy was one of 6 deployed to measure wind speed, direction, pressure, and temperature off the coast of Fire Island, NY.

Science crew aboard R/V Marcus G. Langseth.
Science crew aboard R/V Marcus G. Langseth. Ray Sliter (Pacific Coastal and Marine Science Center) and Deb Hutchison (Woods Hole Coastal and Marine Science Center) shown at far left.
Science crew aboard R/V Marcus G. Langseth. Ray Sliter (Pacific Coastal and Marine Science Center) and Deb Hutchison (Woods Hole Coastal and Marine Science Center) shown at far left.

Map of distribution of substrate mud content, Stellwagen Bank
Map of distribution of substrate mud content, Stellwagen Bank
Map of distribution of substrate mud content, Stellwagen Bank

Photo collage of researchers on personal watercraft at Fire Island
Personal watercraft were utilized to collect bathymetry in the surf zone and shore face (top left), setup on the beach (top right), instrument configuration (bottom left) and Pelican case hardware configuration (bottom right).
Personal watercraft were utilized to collect bathymetry in the surf zone and shore face (top left), setup on the beach (top right), instrument configuration (bottom left) and Pelican case hardware configuration (bottom right).

A time-averaged image from Duck, North Carolina, on September 1, 2015
The relatively new camera stations at Santa Cruz and Madeira Beach have not yet imaged many rip channels, so this is an example from the U.S. Army Corps of Engineers Field Research Facility in Duck, North Carolina. In this time-averaged image from video taken September 1, 2015, the dark horizontal bands perpendicular to the beach indicate rip channels.
The relatively new camera stations at Santa Cruz and Madeira Beach have not yet imaged many rip channels, so this is an example from the U.S. Army Corps of Engineers Field Research Facility in Duck, North Carolina. In this time-averaged image from video taken September 1, 2015, the dark horizontal bands perpendicular to the beach indicate rip channels.

USGS scientist collects precise elevation data in the breach
USGS scientist Owen Brenner walks across the Fire Island wilderness breach carrying a GPS backpack that allows him to collect precise elevation data in the shallows.
USGS scientist Owen Brenner walks across the Fire Island wilderness breach carrying a GPS backpack that allows him to collect precise elevation data in the shallows.

GPS data collection along the Big Sur coast in 2007 (L), and 2015 (R)
Left: USGS research hydrologist Mark Reid (left) and USGS research geologist Kevin Schmidt collect GPS data along the Big Sur coast on September 19, 2007. Photo credit: Maiana Hanshaw, USGS (now with swisstopo).
Left: USGS research hydrologist Mark Reid (left) and USGS research geologist Kevin Schmidt collect GPS data along the Big Sur coast on September 19, 2007. Photo credit: Maiana Hanshaw, USGS (now with swisstopo).
Minipod style tripod for near bottom current and wave measurements
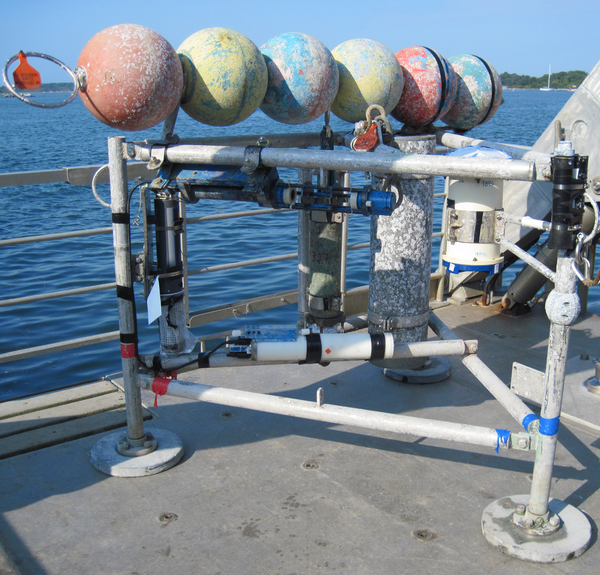
Minipod style tripod for near bottom current and wave measurements ready for deployment.
Minipod style tripod for near bottom current and wave measurements ready for deployment.

Calyptogena spp. in Alaska
These clams (Calyptogena spp.) were discovered in about 1000 meter-deep waters off the southern tip of Alaska near a 250-meter-high cone rising from the seafloor and 10 kilometers from the Queen Charlotte-Fairweather fault.
These clams (Calyptogena spp.) were discovered in about 1000 meter-deep waters off the southern tip of Alaska near a 250-meter-high cone rising from the seafloor and 10 kilometers from the Queen Charlotte-Fairweather fault.

Deploying multibeam sonar
USGS staff and the ship's crew of the R/V Sharp prepare to deploy a deep-water multibeam echosounder during a mapping program in the mid-Atlantic in 2015.
USGS staff and the ship's crew of the R/V Sharp prepare to deploy a deep-water multibeam echosounder during a mapping program in the mid-Atlantic in 2015.

Map of daily-averaged ocean surface current data
Map of daily-averaged ocean surface current data integrated from multiple IOOS Partner forecast models
Map of daily-averaged ocean surface current data integrated from multiple IOOS Partner forecast models

Illustration of the NIMBBLE (New instrument for making bottom boun
Illustration of the NIMBBLE (New instrument for making bottom boundary layer evaluations). The NIMBBLE is a low-profile platform with two acoustic Doppler velocimeters and an upward-looking acoustic Doppler profilers.
Illustration of the NIMBBLE (New instrument for making bottom boundary layer evaluations). The NIMBBLE is a low-profile platform with two acoustic Doppler velocimeters and an upward-looking acoustic Doppler profilers.

Ocean sand in wetland core
A vibracore taken from a marshy area in Anahola Valley, Kaua‛i reveals a sandier mud layer.
A vibracore taken from a marshy area in Anahola Valley, Kaua‛i reveals a sandier mud layer.