
Hurricane Sandy (2012) modeling: Modeling can reveal the contributions from underlying processes individually. These images show contribution from offshore surge (change in water level) and offshore waves to maximum water levels (in meters) within a bay during a coastal storm.
Images
Images intro.

Model output of offshore surges and waves
Hurricane Sandy (2012) modeling: Modeling can reveal the contributions from underlying processes individually. These images show contribution from offshore surge (change in water level) and offshore waves to maximum water levels (in meters) within a bay during a coastal storm.

Fort Funston Structure-from-Motion point clouds
As part of the Remote Sensing of Coastal Change and Florence Supplemental projects we have been developing novel workflows for repeat-mapping of coastal environments at order decimeter resolution over up to hundreds of kilometers in a single day, using Structure-from-Motion photogrammetry or SfM, from crewed aerial platforms.
As part of the Remote Sensing of Coastal Change and Florence Supplemental projects we have been developing novel workflows for repeat-mapping of coastal environments at order decimeter resolution over up to hundreds of kilometers in a single day, using Structure-from-Motion photogrammetry or SfM, from crewed aerial platforms.

USGS science on a map of the Carolinas after Hurricane Florence
This flood event viewer map, dated Oct. 3, 2018, shows the extent and type of information collected by USGS hydrologists in North and South Carolina in the wake of historic flooding brought on by Hurricane Florence.
This flood event viewer map, dated Oct. 3, 2018, shows the extent and type of information collected by USGS hydrologists in North and South Carolina in the wake of historic flooding brought on by Hurricane Florence.

Double-checking a high water mark on a church door near Maxton, NC
USGS hydrographer Daniel McCay uses a level to double-check a high water mark on a church door near Maxton, NC as his USGS colleague Mary Winsor observes on Sept. 25, 2018, in the wake of flooding brought on by Hurricane Florence.
USGS hydrographer Daniel McCay uses a level to double-check a high water mark on a church door near Maxton, NC as his USGS colleague Mary Winsor observes on Sept. 25, 2018, in the wake of flooding brought on by Hurricane Florence.

A high water mark above the eaves of a Spring Hill, NC house
USGS hydrologic technician Rob Forde flags a high water mark above the eaves at Presbyterian Church of the Covenant, 118 Manchester Road, Spring Hill, North Carolina on Sept. 21, 2018, in the wake of flooding brought on by Hurricane Florence.
USGS hydrologic technician Rob Forde flags a high water mark above the eaves at Presbyterian Church of the Covenant, 118 Manchester Road, Spring Hill, North Carolina on Sept. 21, 2018, in the wake of flooding brought on by Hurricane Florence.

Measuring a high water mark as flooding recedes
USGS hydrographer Kyle Marchman measures a high water mark on the rear wall of a Kangaroo gas station on Highway 24 north of Fayetteville, NC on Sept. 18, 2018, after flooding caused by Hurricane Florence.
USGS hydrographer Kyle Marchman measures a high water mark on the rear wall of a Kangaroo gas station on Highway 24 north of Fayetteville, NC on Sept. 18, 2018, after flooding caused by Hurricane Florence.

Measuring the Lumber River floodwaters
James Stonecypher measures flood waters from the Lumber River that breached a dam in Lumberton, North Carolina after the passage of Hurricane Florence, Sept. 17, 2018.
James Stonecypher measures flood waters from the Lumber River that breached a dam in Lumberton, North Carolina after the passage of Hurricane Florence, Sept. 17, 2018.
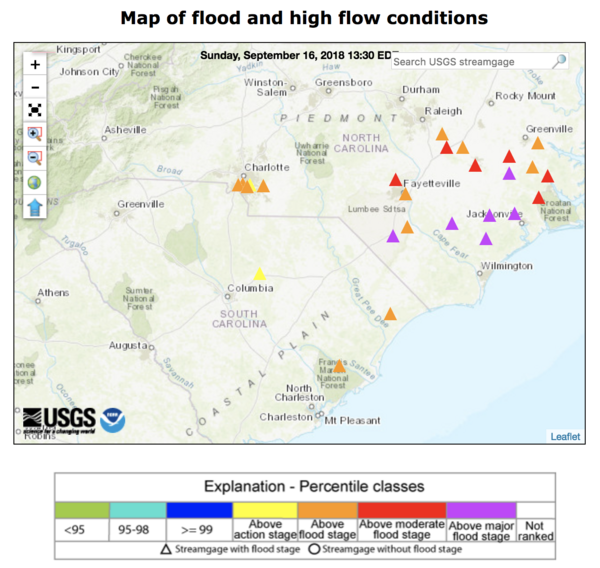
As Florence rains, rivers keep rising, submerging some USGS instrument
A WaterWatch web map shows streamgages in North and South Carolina that approached or exceeded major flood stage EST on September 19, 2018, as the former Hurricane Florence, now downgraded to a tropical depression, deluged the states with rain.
A WaterWatch web map shows streamgages in North and South Carolina that approached or exceeded major flood stage EST on September 19, 2018, as the former Hurricane Florence, now downgraded to a tropical depression, deluged the states with rain.

Working to keep vital flood information flowing in the Carolinas
David Stillwell, USGS hydrologic technician, performs a discharge measurement to help document and forecast flooding caused by Hurricane Florence at Long Creek in Rhyne, North Carolina on Sept. 16.
David Stillwell, USGS hydrologic technician, performs a discharge measurement to help document and forecast flooding caused by Hurricane Florence at Long Creek in Rhyne, North Carolina on Sept. 16.

Strom sensor deployed in Pennsylvania for Hurricane Florence
This photo shows one of 8 storm sensors deployed in Pennsylvania to monitor the potential effects Hurricane Florence could have on already high rivers across the state. Photo by Matthew Gyves, USGS.
This photo shows one of 8 storm sensors deployed in Pennsylvania to monitor the potential effects Hurricane Florence could have on already high rivers across the state. Photo by Matthew Gyves, USGS.

Hurricane Florence will erode or overwash beaches
The USGS Coastal Change Hazards Storm Team has forecast coast-wide levels of beach erosion, inundation and overwash due to Hurricane Florence's expected path and landgfall.
The USGS Coastal Change Hazards Storm Team has forecast coast-wide levels of beach erosion, inundation and overwash due to Hurricane Florence's expected path and landgfall.

Sea water levels to go up, stay up as Florence affects coast
The Coastal Change Hazards Storm Team has forecast changing water levels at specific locations over time.
The Coastal Change Hazards Storm Team has forecast changing water levels at specific locations over time.

USGS Storm-Tide Sensor for Hurricane Florence
A USGS storm-tide sensor, deployed in advance of Hurricane Florence's landfall. The sensors are housed in vented steel pipes a few inches wide and about a foot long. They are being installed on bridges, piers, and other structures that have a good chance of surviving the storm.
A USGS storm-tide sensor, deployed in advance of Hurricane Florence's landfall. The sensors are housed in vented steel pipes a few inches wide and about a foot long. They are being installed on bridges, piers, and other structures that have a good chance of surviving the storm.

USGS Scientists Get Ready for Hurricanes
A USGS hydrologic scientist installs a storm-tide sensor near the North Carolina coast as Hurricane Florence approaches.
A USGS hydrologic scientist installs a storm-tide sensor near the North Carolina coast as Hurricane Florence approaches.

USGS storm-tide sensor installed for Hurricane Florence
This USGS storm-tide sensor was installed Sept. 9 in Dare County, North Carolina, in preparation for Hurricane Florence. Photo by Steve Harden, USGS.
This USGS storm-tide sensor was installed Sept. 9 in Dare County, North Carolina, in preparation for Hurricane Florence. Photo by Steve Harden, USGS.