EDDI Trends 2017
By Climate Adaptation Science Centers
2018 (approx.)
![Map of US showing Evaporative Demands](https://d9-wret.s3.us-west-2.amazonaws.com/assets/palladium/production/s3fs-public/styles/full_width/public/thumbnails/image/EDDITrends-2017_NP-Drought_2.jpg?itok=q4IS5--r)
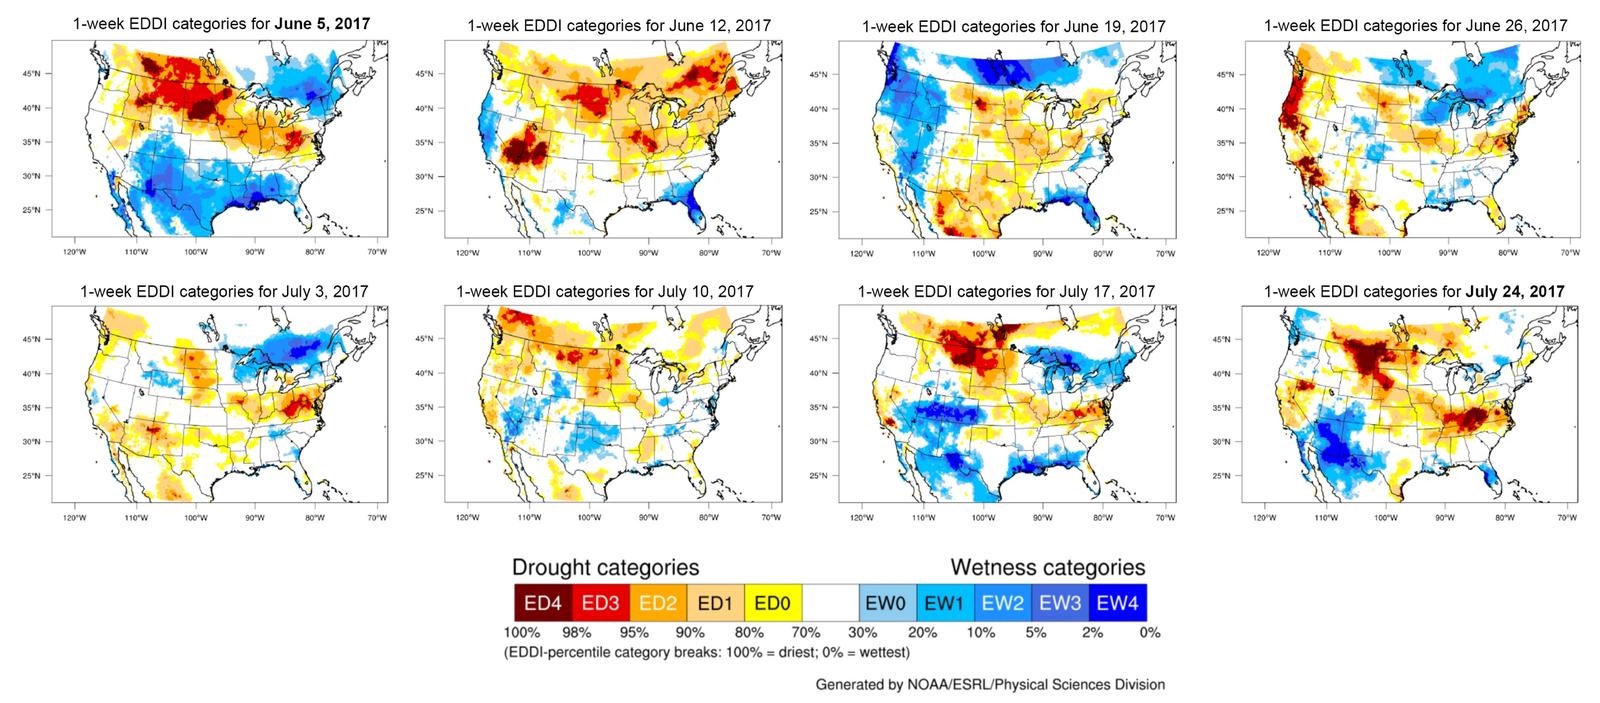
Detailed Description
Map of US showing Evaporative Demands in 2017.
Sources/Usage
NOAA, ESRL, Physical Sciences Division
Map of US showing Evaporative Demands in 2017.
NOAA, ESRL, Physical Sciences Division