
Hypothetical abundance (N) time series (a, b, c) at two spatial scales
By Fort Collins Science Center
January 2024 (approx.)
Detailed Description
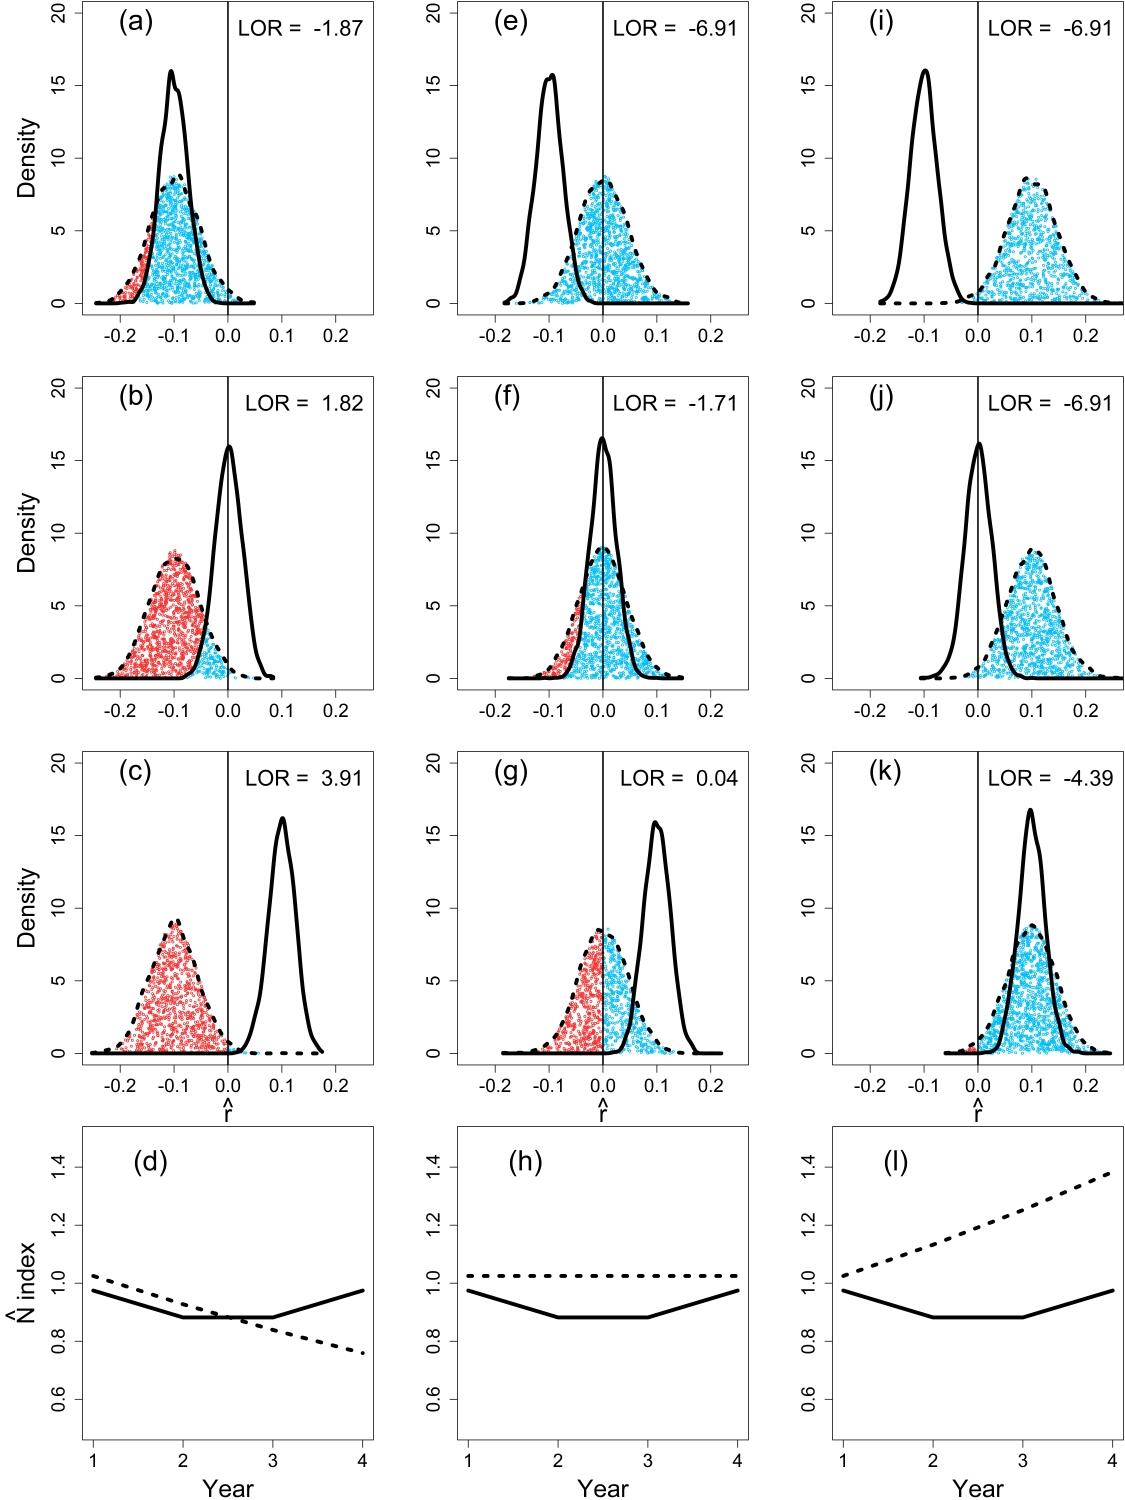
Hypothetical abundance (N) time series (a, b, c) at two spatial scales. Populations targeted for possible management intervention exist at small spatial scales (dashed line). Control populations representing climatic factors exist at large spatial scales (solid line). Evidence of aberrant decline (decline caused from local factors) across the three scenarios is generally strong (a), moderate (b), and weak (c).
Sources/Usage
Public Domain.