
Figure from Norton et al Remote Sens, 2021, 13

Detailed Description
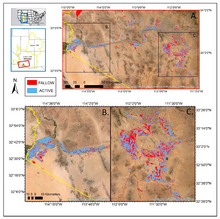
The study regions in 2017 (A), including the lower Colorado river planning (LCRP) area (B), and the Pinal and Phoenix active management areas (PPAMA) (C). Base map shows the 2017 fallow-land algorithm based on neighborhood and temporal anomalies (FANTA) active (blue) and fallow (red) cropland classification. Inset map in upper-left outlines in yellow the upper and lower Colorado River Basin (CRB) and in red the region of interest for this study.
Figure from Norton, C.L., Dannenberg, M.P., Yan, D., Wallace, C.S., Rodriguez, J.R., Munson, S.M., van Leeuwen, W.J. and Smith, W.K., 2021. Climate and socioeconomic factors drive irrigated agriculture dynamics in the Lower Colorado River Basin. Remote Sensing 13(9): 1659, https://www.mdpi.com/2072-4292/13/9/1659
Sources/Usage
Public Domain.