Suitability_Index.png

Detailed Description
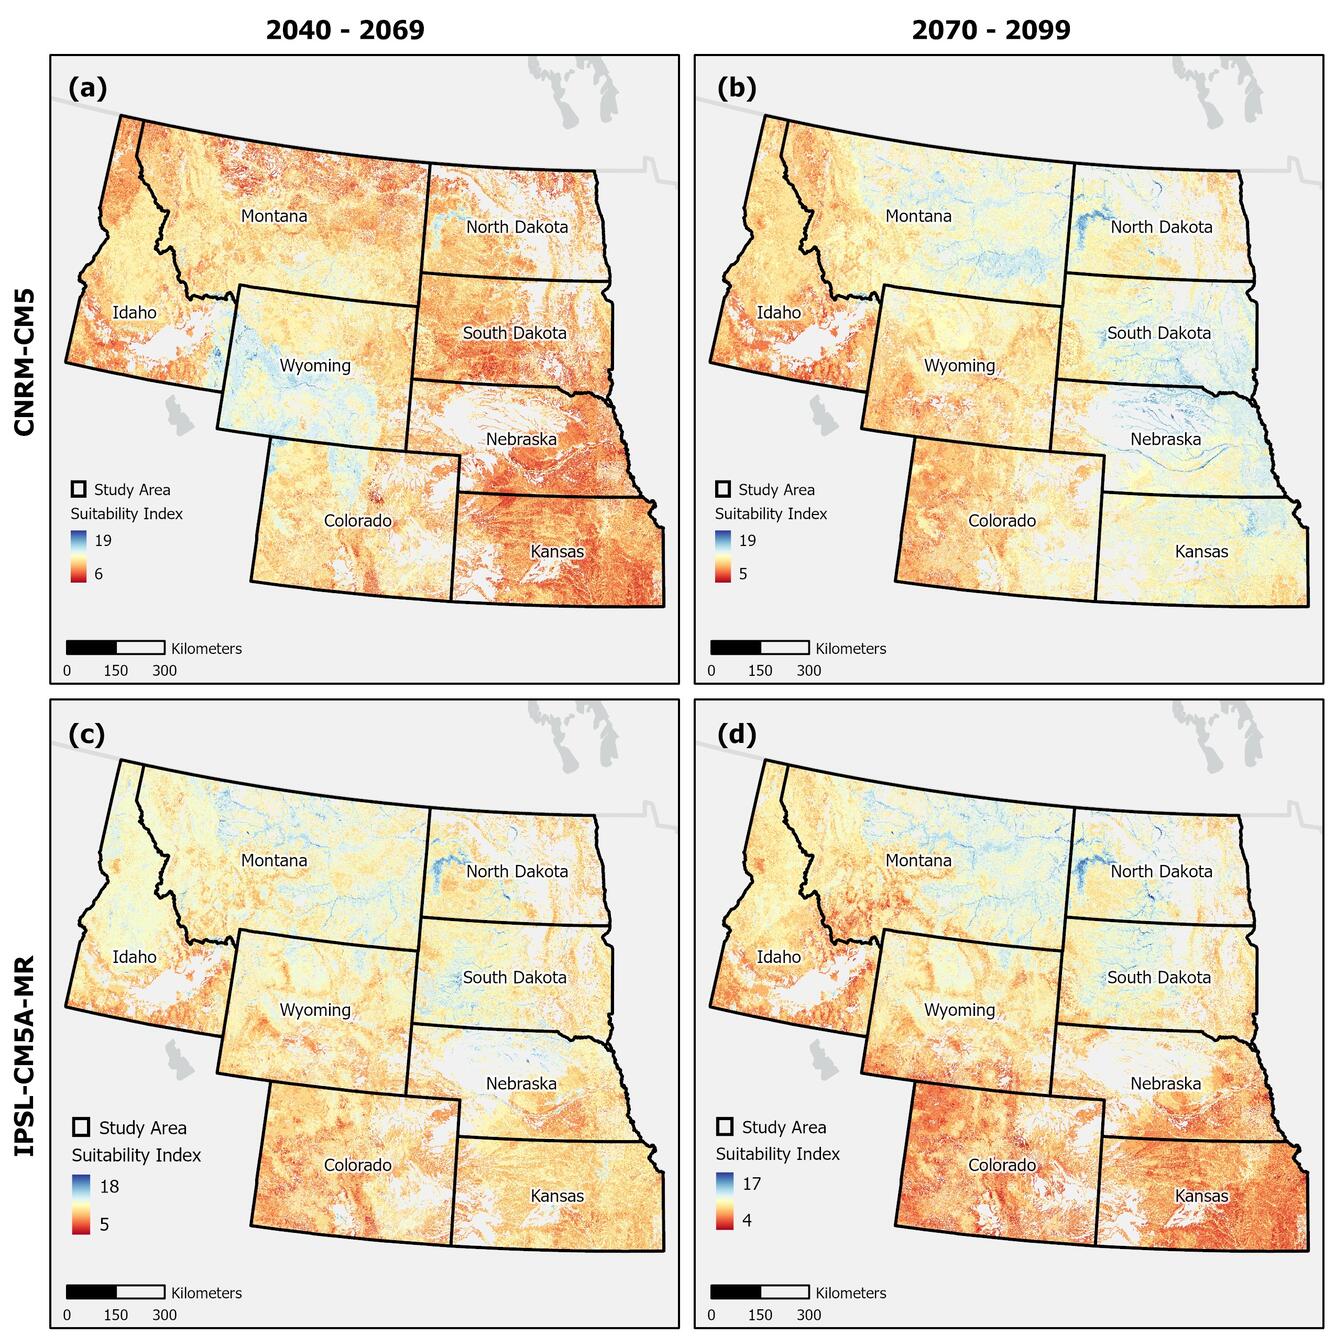
Riparian refugia quality based on projected changes in summer warmth and landscape runoff from the CNRM-CM5 (a, b; moderately hot and wet) and IPSL-CM5A-MR (c, d; hot and dry) climate models for mid-century (a, c; 2040–2069) and late century (b, d; 2070–2099), compared to historical climate conditions (1971–2000). Suitability indices could range from 4 to 20, with higher values reflecting greater expected climate resilience. Note that the range of realized index values differed among climate scenarios and thus maps.
Sources/Usage
Public Domain.

