
Non-Tidal Network 1985-2020


Detailed Description
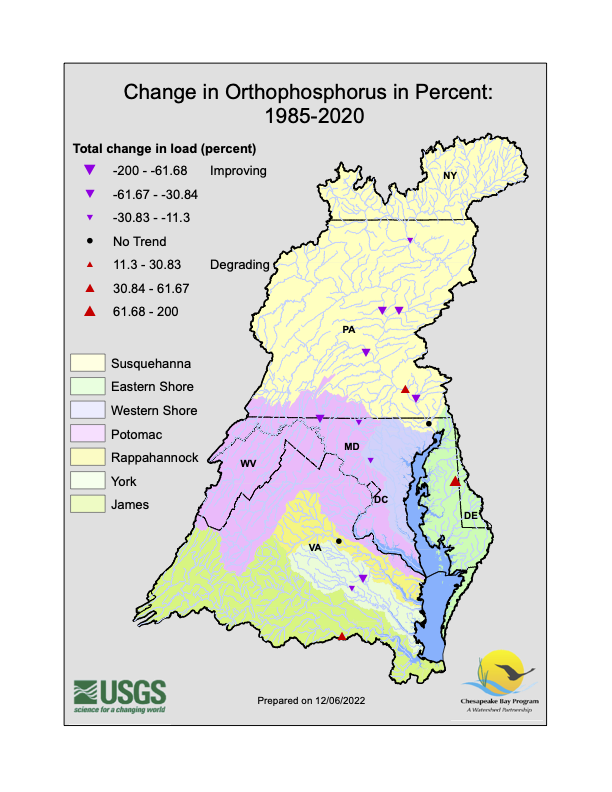
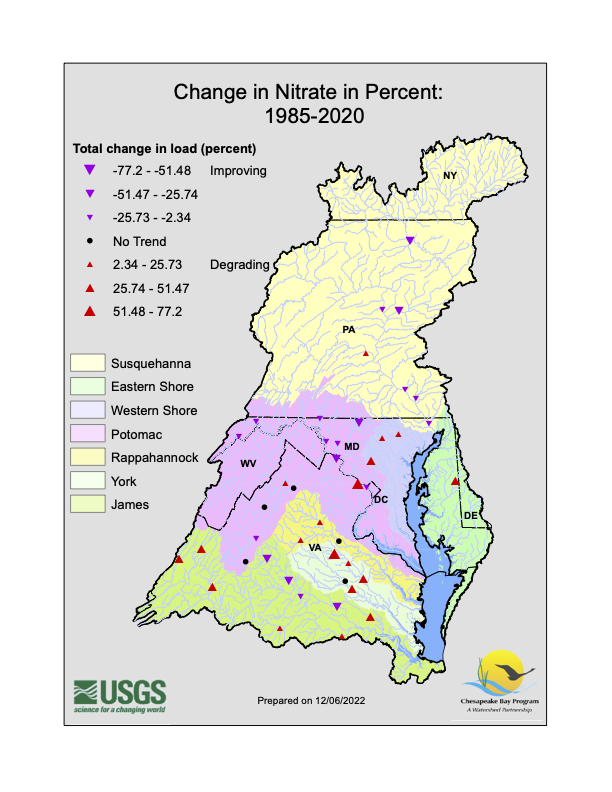
A slideshow of ten maps detailing change in nitrate, orthophosphorus, suspended sediment, total nitrogen, and total phosphorus in the Chesapeake Bay from 1985 to 2020.
Sources/Usage
Public Domain.
Related Content

Chesapeake Bay Water-Quality Loads and Trends
Access the most recent data gathered from the Chesapeake Bay Nontidal Monitoring Network , learn about the techniques used to collect this data, and read about the history of the Chesapeake Bay Nontidal Monitoring Program. Nontidal Network (NTN) data refers to data from the 123 monitoring stations where nutrients and sediment are collected monthly and during storms. River Input Monitoring (RIM)...
Related Content
Chesapeake Bay Water-Quality Loads and Trends
Access the most recent data gathered from the Chesapeake Bay Nontidal Monitoring Network , learn about the techniques used to collect this data, and read about the history of the Chesapeake Bay Nontidal Monitoring Program. Nontidal Network (NTN) data refers to data from the 123 monitoring stations where nutrients and sediment are collected monthly and during storms. River Input Monitoring (RIM)...