30 Years of the National Land Cover Database (NLCD)
The NLCD stands as the definitive land cover database for the United States

Official websites use .gov
A .gov website belongs to an official government organization in the United States.
Secure .gov websites use HTTPS
A lock () or https:// means you’ve safely connected to the .gov website. Share sensitive information only on official, secure websites.

30 Years of the National Land Cover Database (NLCD)
The NLCD stands as the definitive land cover database for the United States
30 Years of the National Land Cover Database (NLCD)
The NLCD stands as the definitive land cover database for the United States

Corey Lawrence is a Research Geologist with the US Geological Survey at the Geosciences Environmental Change Science Center in Denver, CO. Corey earned a PhD in Geological Sciences from the University of Colorado Boulder, where he studied the impacts of aeolian deposition on soil development and biogeochemistry in the Rocky Mountains.
Corey Lawrence is a Research Geologist with the US Geological Survey at the Geosciences Environmental Change Science Center in Denver, CO. Corey earned a PhD in Geological Sciences from the University of Colorado Boulder, where he studied the impacts of aeolian deposition on soil development and biogeochemistry in the Rocky Mountains.

Landsat 7 Image of the Southern Fringe of the Rub' al-Khali Sand Desert near Al-Hashman, Oman. This gap-filled image was captured on January 18, 2024 and is shown using the shortwave infrared, near infrared and red bands (Bands 5|4|3).
To learn more about the Landsat Program visit www.usgs.gov/landsat

This image, displaying a small area of the Sea of Okhotsk shoreline, is one of over 4,000 Landsat 8 Level-1 scenes that were acquired between January 1 and January 6, 2024, and reprocessed on January 12, 2024 with an updated Calibration Parameter file.
This image, displaying a small area of the Sea of Okhotsk shoreline, is one of over 4,000 Landsat 8 Level-1 scenes that were acquired between January 1 and January 6, 2024, and reprocessed on January 12, 2024 with an updated Calibration Parameter file.

Topobathymetric digital elevation model of the Kootenai River, Idaho. Image was created by Cindy Thatcher.
Topobathymetric digital elevation model of the Kootenai River, Idaho. Image was created by Cindy Thatcher.

The 3D National Topography Model (3DNTM) is a vision for an integrated 3D model of elevation and hydrography data that will support environmental, climate change, and infrastructure applications. It responds to changing U.S. policy and will support Federal, State, local, and other stakeholder needs.
The 3D National Topography Model (3DNTM) is a vision for an integrated 3D model of elevation and hydrography data that will support environmental, climate change, and infrastructure applications. It responds to changing U.S. policy and will support Federal, State, local, and other stakeholder needs.

This graph shows the number of compute hours on the USGS Supercomputers for Fiscal Years 2019-2023.
This graph shows the number of compute hours on the USGS Supercomputers for Fiscal Years 2019-2023.

Background: USGS Photo of Porkchop Geyer in Yellowstone. Foreground: A cartoon turkey wearing an astronaut helmet looks sheepishly at Porkchop Geyser erupting nearby. Cartoon images of common Thanksgiving side dishes are also placed around the turkey (in this case, a gravy boat and an ear of corn).
Background: USGS Photo of Porkchop Geyer in Yellowstone. Foreground: A cartoon turkey wearing an astronaut helmet looks sheepishly at Porkchop Geyser erupting nearby. Cartoon images of common Thanksgiving side dishes are also placed around the turkey (in this case, a gravy boat and an ear of corn).

A model of the Unisphere project on display at the Old Courthouse Museum in Sioux Falls, South Dakota. The concept of the project, originally called “Erosphere,” included a science center, farm of the future, visitor center, and space for scientific conventions.
A model of the Unisphere project on display at the Old Courthouse Museum in Sioux Falls, South Dakota. The concept of the project, originally called “Erosphere,” included a science center, farm of the future, visitor center, and space for scientific conventions.

A simplified view of the classical model for terrestrial planet formation (not to scale). From top to bottom: The central star is surrounded by nebular gas and dust where early solids form.
A simplified view of the classical model for terrestrial planet formation (not to scale). From top to bottom: The central star is surrounded by nebular gas and dust where early solids form.

This map of the United States and its territories shows the areal extent and quality level of planned, in-progress, and existing publicly available lidar (IfSAR in Alaska) data identified by the United States Interagency Elevation Inventory (USIEI) that meet 3DEP base level specification planned to be under award by September 30, 2023. 3DEP base level spec
This map of the United States and its territories shows the areal extent and quality level of planned, in-progress, and existing publicly available lidar (IfSAR in Alaska) data identified by the United States Interagency Elevation Inventory (USIEI) that meet 3DEP base level specification planned to be under award by September 30, 2023. 3DEP base level spec

Natural color image of the White Mountain National Forest, New Hampshire, as seen by Landsat 9 on October 4th, 2023.
WRS-2 Path 013 Row 029.
Bands 4,3,2
Landsat Scene ID LC09_L2SP_013029_20231004_20231005_02_T1
Natural color image of the White Mountain National Forest, New Hampshire, as seen by Landsat 9 on October 4th, 2023.
WRS-2 Path 013 Row 029.
Bands 4,3,2
Landsat Scene ID LC09_L2SP_013029_20231004_20231005_02_T1

This image shows the Landsat flight Operations Team monitoring a pre burn contact, ensuring the satellite is ready for the maneuver.
This image shows the Landsat flight Operations Team monitoring a pre burn contact, ensuring the satellite is ready for the maneuver.

This map of the United States and its territories shows geographic extent of planned, existing, and in-progress 3DEP data acquisition projects by year.
This map of the United States and its territories shows geographic extent of planned, existing, and in-progress 3DEP data acquisition projects by year.

This map of the United States and its territories shows geographic extent of the first-ever nationally consistent hydrography data acquired from high-resolution 3D Elevation Program (3DEP) data. FY23 projects are the result of ongoing Federal coordination via the 3DHP Working Group and the Alaska Mapping Initiative.
This map of the United States and its territories shows geographic extent of the first-ever nationally consistent hydrography data acquired from high-resolution 3D Elevation Program (3DEP) data. FY23 projects are the result of ongoing Federal coordination via the 3DHP Working Group and the Alaska Mapping Initiative.

This map of Alaska shows geographic extent of the first-ever nationally consistent hydrography data acquired from high-resolution 3D Elevation Program (3DEP) data. FY23 projects are the result of ongoing Federal coordination via the 3DHP Working Group and the Alaska Mapping Initiative.
Explanation
This map of Alaska shows geographic extent of the first-ever nationally consistent hydrography data acquired from high-resolution 3D Elevation Program (3DEP) data. FY23 projects are the result of ongoing Federal coordination via the 3DHP Working Group and the Alaska Mapping Initiative.
Explanation

This map of Alaska shows geographic extent of the first-ever nationally consistent hydrography data acquired from high-resolution 3D Elevation Program (3DEP) data. FY23 projects are the result of ongoing Federal coordination via the 3DHP Working Group and the Alaska Mapping Initiative.
Explanation
This map of Alaska shows geographic extent of the first-ever nationally consistent hydrography data acquired from high-resolution 3D Elevation Program (3DEP) data. FY23 projects are the result of ongoing Federal coordination via the 3DHP Working Group and the Alaska Mapping Initiative.
Explanation

This animated GIF is a map of the United States and its territories shows geographic extent of planned, existing, and in-progress 3DEP data acquisition projects by year.
This animated GIF is a map of the United States and its territories shows geographic extent of planned, existing, and in-progress 3DEP data acquisition projects by year.

This map of the United States and its territories shows geographic extent of the first-ever nationally consistent hydrography data acquired from high-resolution 3D Elevation Program (3DEP) data. FY23 projects are the result of ongoing Federal coordination via the 3DHP Working Group and the Alaska Mapping Initiative.
This map of the United States and its territories shows geographic extent of the first-ever nationally consistent hydrography data acquired from high-resolution 3D Elevation Program (3DEP) data. FY23 projects are the result of ongoing Federal coordination via the 3DHP Working Group and the Alaska Mapping Initiative.

Fall foliage surrounds the 60-foot radome at the Earth Resources Observation and Science (EROS) Center in Sioux Falls, South Dakota. The radome protects the 10-meter Landsat antenna.
Fall foliage surrounds the 60-foot radome at the Earth Resources Observation and Science (EROS) Center in Sioux Falls, South Dakota. The radome protects the 10-meter Landsat antenna.
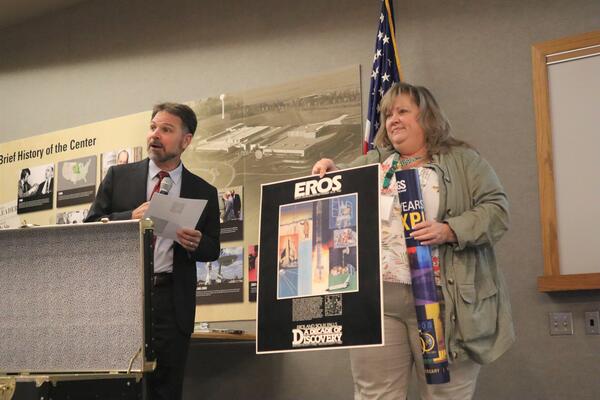
While USGS Earth Resources Observation and Science (EROS) Center Director Pete Doucette tells the audience a little about the 10th anniversary festivities at EROS during the August 18, 2023, rededication ceremony, EROS Branch Chief for New Missions Kristi Kline holds up a 10th anniversary poster from the time capsule and prepares to add a 50
While USGS Earth Resources Observation and Science (EROS) Center Director Pete Doucette tells the audience a little about the 10th anniversary festivities at EROS during the August 18, 2023, rededication ceremony, EROS Branch Chief for New Missions Kristi Kline holds up a 10th anniversary poster from the time capsule and prepares to add a 50