
Prior to landfall on the Florida coast on October 9, 2024, the Coastal Change Hazards Team predicted that 86 percent of beaches along the west coast of the Florida peninsula were very likely to erode at the dunes’ base, 82 percent of dunes were very likely to be overwashed by storm waves, and 75 percent of dunes were expected to be very likely to be inundated (
Images
Images from hurricane studies.
Filter Total Items: 37

USGS Coastal Change Hazards Portal shows potential coastal change from Hurricane Milton
Prior to landfall on the Florida coast on October 9, 2024, the Coastal Change Hazards Team predicted that 86 percent of beaches along the west coast of the Florida peninsula were very likely to erode at the dunes’ base, 82 percent of dunes were very likely to be overwashed by storm waves, and 75 percent of dunes were expected to be very likely to be inundated (

Breakout Table 4 Discussion of the Mayagüez Session of the USGS Workshop in Puerto Rico Titled “Participatory Engagement for Storm Management”
linkBreakout Table 4 Discussion of the Mayagüez Session of the USGS Workshop in Puerto Rico Titled “Participatory Engagement for Storm Management.”
Breakout Table 4 Discussion of the Mayagüez Session of the USGS Workshop in Puerto Rico Titled “Participatory Engagement for Storm Management”
linkBreakout Table 4 Discussion of the Mayagüez Session of the USGS Workshop in Puerto Rico Titled “Participatory Engagement for Storm Management.”

Breakout Table 1 Discussion of the Mayagüez Session of the USGS Workshop in Puerto Rico Titled “Participatory Engagement for Storm Management”
linkBreakout Table 1 Discussion of the Mayagüez Session of the USGS Workshop in Puerto Rico Titled “Participatory Engagement for Storm Management.”
Breakout Table 1 Discussion of the Mayagüez Session of the USGS Workshop in Puerto Rico Titled “Participatory Engagement for Storm Management”
linkBreakout Table 1 Discussion of the Mayagüez Session of the USGS Workshop in Puerto Rico Titled “Participatory Engagement for Storm Management.”

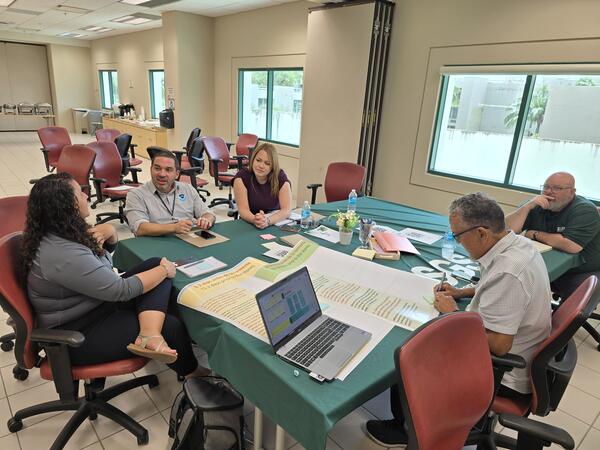
Group Photo of the Mayagüez Session of the USGS Workshop in Puerto Rico Titled “Participatory Engagement for Storm Management”
linkGroup Photo of the Mayagüez Session of the USGS Workshop in Puerto Rico Titled “Participatory Engagement for Storm Management”Top row, from left to right: Priscila Vargas-Babilonia, Jaileen López Belén, Jack R. Friedman, Carmen Pérez, Milton Muñoz, Stephen Hughes, Ariam L. Torres-Cordero, Manuel Valdés-Pizzini, Carlos J. Carrero, Tania López, Adlin Melecio.

Breakout Table 2 Discussion of the Mayagüez Session of the USGS Workshop in Puerto Rico Titled “Participatory Engagement for Storm Management”
linkBreakout Table 2 Discussion of the Mayagüez Session of the USGS Workshop in Puerto Rico Titled “Participatory Engagement for Storm Management.”
Breakout Table 2 Discussion of the Mayagüez Session of the USGS Workshop in Puerto Rico Titled “Participatory Engagement for Storm Management”
linkBreakout Table 2 Discussion of the Mayagüez Session of the USGS Workshop in Puerto Rico Titled “Participatory Engagement for Storm Management.”

Breakout Table 3 Discussion of the Mayagüez Session of the USGS Workshop in Puerto Rico Titled “Participatory Engagement for Storm Management”
linkBreakout Table 3 Discussion of the Mayagüez Session of the USGS Workshop in Puerto Rico Titled “Participatory Engagement for Storm Management”
Breakout Table 3 Discussion of the Mayagüez Session of the USGS Workshop in Puerto Rico Titled “Participatory Engagement for Storm Management”
linkBreakout Table 3 Discussion of the Mayagüez Session of the USGS Workshop in Puerto Rico Titled “Participatory Engagement for Storm Management”

Group Photo of the Mayagüez Session of the USGS Workshop in Puerto Rico Titled “Participatory Engagement for Storm Management”
linkGroup Photo of the Mayagüez Session of the USGS Workshop in Puerto Rico Titled “Participatory Engagement for Storm Management.” Top row, from left to right: Priscila Vargas-Babilonia, Jaileen López Belén, Jack R. Friedman, Carmen Pérez, Milton Muñoz, Stephen Hughes, Ariam L. Torres-Cordero, Manuel Valdés-Pizzini, Carlos J. Carrero, Tania López, Adlin Melecio.

Afternoon Group Photo of the Río Piedras Session of the USGS Workshop in Puerto Rico Titled “Participatory Engagement for Storm Management”
linkAfternoon Group Photo of the Río Piedras Session of the USGS Workshop in Puerto Rico Titled “Participatory Engagement for Storm Management.” Top row, left to right: Héctor Rivera, Carlos Anselmi-Molina, Aurelio “Tito” Castro, Jack R. Friedman, Kevian Pérez. Second row, left to right: Orlando Díaz Flores, Manuel Valdés-Pizzini, Ariam L.

Breakout Table 3 Report Out of the Río Piedras Session of the USGS Workshop in Puerto Rico Titled “Participatory Engagement for Storm Management”
linkBreakout Table 3 Report Out of the Río Piedras Session of the USGS Workshop in Puerto Rico Titled “Participatory Engagement for Storm Management.”
Breakout Table 3 Report Out of the Río Piedras Session of the USGS Workshop in Puerto Rico Titled “Participatory Engagement for Storm Management”
linkBreakout Table 3 Report Out of the Río Piedras Session of the USGS Workshop in Puerto Rico Titled “Participatory Engagement for Storm Management.”

Breakout Table 1 Discussion of the Río Piedras Session of the USGS Workshop in Puerto Rico Titled “Participatory Engagement for Storm Management”
linkBreakout Table 1 Discussion of the Río Piedras Session of the USGS Workshop in Puerto Rico Titled “Participatory Engagement for Storm Management.”
Breakout Table 1 Discussion of the Río Piedras Session of the USGS Workshop in Puerto Rico Titled “Participatory Engagement for Storm Management”
linkBreakout Table 1 Discussion of the Río Piedras Session of the USGS Workshop in Puerto Rico Titled “Participatory Engagement for Storm Management.”
Breakout Table 4 Discussion of the Río Piedras Session of the USGS Workshop in Puerto Rico Titled “Participatory Engagement for Storm Management”
linkBreakout Table 4 Discussion of the Río Piedras Session of the USGS Workshop in Puerto Rico Titled “Participatory Engagement for Storm Management.”
Breakout Table 4 Discussion of the Río Piedras Session of the USGS Workshop in Puerto Rico Titled “Participatory Engagement for Storm Management”
linkBreakout Table 4 Discussion of the Río Piedras Session of the USGS Workshop in Puerto Rico Titled “Participatory Engagement for Storm Management.”

Breakout Table 2 Discussion of the Río Piedras Session of the USGS Workshop in Puerto Rico Titled “Participatory Engagement for Storm Management”
linkBreakout Table 2 Discussion of the Río Piedras Session of the USGS Workshop in Puerto Rico Titled “Participatory Engagement for Storm Management”
Breakout Table 2 Discussion of the Río Piedras Session of the USGS Workshop in Puerto Rico Titled “Participatory Engagement for Storm Management”
linkBreakout Table 2 Discussion of the Río Piedras Session of the USGS Workshop in Puerto Rico Titled “Participatory Engagement for Storm Management”

Morning Group Photo of the Río Piedras Session of the USGS Workshop in Puerto Rico Titled “Participatory Engagement for Storm Management”
linkMorning Group Photo of the Río Piedras Session of the USGS Workshop in Puerto Rico Titled “Participatory Engagement for Storm Management.” Top row, left to right: Carlos R. Olmedo Álvarez, Francisco “Paco” López, Ernesto Rodríguez, Aurelio “Tito” Castro, Federico Subervi Vélez, Kevian Pérez, Carlos Anselmi-Molina, Aurora Justiniano, Jack R. Friedman.

USGS Coastal Change Hazards Portal shows Hurricane Beryl's expected impacts
Potential coastal change impacts are predicted during a direct landfall of Hurricane Beryl on the Texas coast at 4:00 am, Sunday, July 7, 2024.
Potential coastal change impacts are predicted during a direct landfall of Hurricane Beryl on the Texas coast at 4:00 am, Sunday, July 7, 2024.

Hurricane Ian approaching Florida
This image shows Hurricane Ian making its first U.S. landfall in southwest Florida near Cayo Costa September 28, 2022, bringing with it extreme storm surge, category 4 winds and a deluge of rain. Ian made a second U.S. landfall September 30, 2022, in Georgetown, South Carolina. Photos by NOAA.
This image shows Hurricane Ian making its first U.S. landfall in southwest Florida near Cayo Costa September 28, 2022, bringing with it extreme storm surge, category 4 winds and a deluge of rain. Ian made a second U.S. landfall September 30, 2022, in Georgetown, South Carolina. Photos by NOAA.

Hurricane Maria Impacting the Eastern Caribbean
Colorized satellite imagery from 2017-09-19 15:00 UTC of Hurricane Maria impacting the Eastern Caribbean. Data provided by NOAA. Base image is intellectual property of NOAA and is used herein under license. Copyright Esri and its creator.
Colorized satellite imagery from 2017-09-19 15:00 UTC of Hurricane Maria impacting the Eastern Caribbean. Data provided by NOAA. Base image is intellectual property of NOAA and is used herein under license. Copyright Esri and its creator.

Hurricane Tracks, Puerto Rico
Hurricane tracks for Hugo (1989), Georges (1998), Irma (2017) and Maria (2017). Data provided by NOAA. Base image is intellectual property of Esri and is used herein under license. Copyright Esri and its creator.
Hurricane tracks for Hugo (1989), Georges (1998), Irma (2017) and Maria (2017). Data provided by NOAA. Base image is intellectual property of Esri and is used herein under license. Copyright Esri and its creator.

Pre and Post Hurricane Dorian Aerial Imagery
Pre- and post-Hurricane Dorian aerial imagery showing extreme sediment transport, overwash and breaches along the barrier islands of the North Carolina coast.
Pre- and post-Hurricane Dorian aerial imagery showing extreme sediment transport, overwash and breaches along the barrier islands of the North Carolina coast.

Hurricane Dorian water level changes.
Land surface elevation and modeled water level changes at Pamlico Sound during Hurricane Dorian. Small red box shows where the breaches to barrier islands were modeled.
Land surface elevation and modeled water level changes at Pamlico Sound during Hurricane Dorian. Small red box shows where the breaches to barrier islands were modeled.
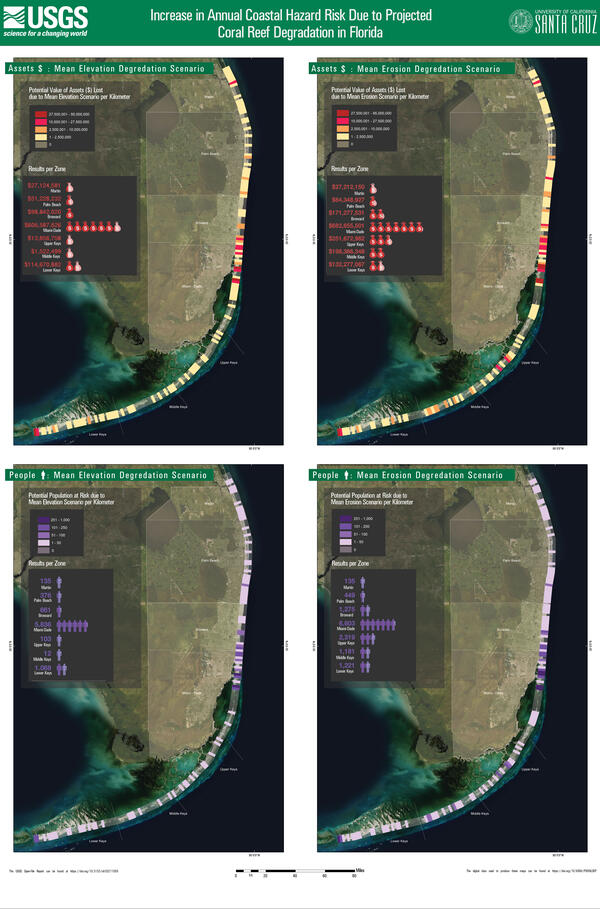
Coastal hazard risk increase due to reef degradation: Florida
Four scenarios for the southern part of the Florida coastline show the increase in annual coastal hazard risk due to projected coral reef degradation.
Four scenarios for the southern part of the Florida coastline show the increase in annual coastal hazard risk due to projected coral reef degradation.

Annual coastal hazard risk increase due to hurricanes in Florida
Maps for the southern part of the Florida coastline show the increase in annual coastal hazard risk due to damage by Hurricanes Irma and Maria.
- Increase in population at risk due to coral reef damage per kilometer (left)
- Increase in value ($) of assets at risk due to coral reef damage per kilometer (right)