
The User Interface
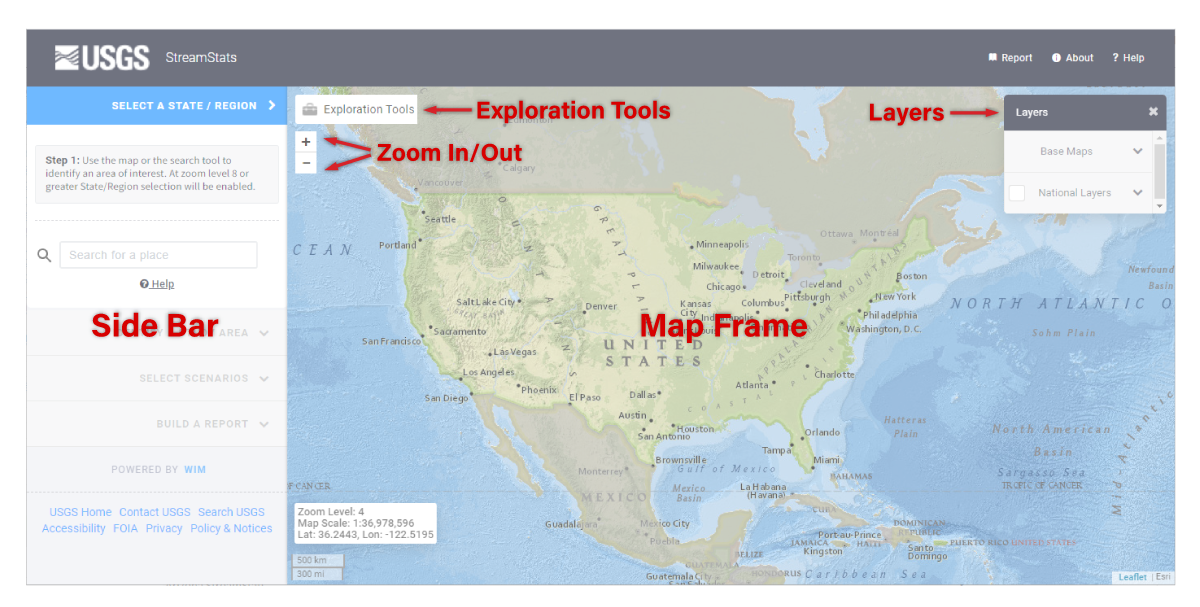
StreamStats version 4 provides a single national user interface through which the application for any implemented state can be accessed. The two main areas on the user interface are the Map Frame and the Sidebar. Also, in the black banner above the map are the Help, About, and Report links, which are explained below.
The Map Frame, forming the major part on the user interface, displays base maps and additional map layers, such as streamgage locations. The map is used primarily to locate places of interest and get information. Initially, the map is focused on North America.
Within the Map Frame are buttons for changing the scale of the map (zooming in and out), viewing the map legend and selecting map layers, and accessing the Exploration Tools, which are discussed in the Exploration Tools section.
The Sidebar, to the left of the Map Frame, presents a series of banners that will open like an accordion when the banner is selected to expose a panel with instructions in a gray box just below the banner and tool buttons below the instructions. The active banner will appear in dark blue. Inactive banners appear in light gray. The provided instructions guide the user through the steps necessary to delineate a basin, calculate basin characteristics, and compute flow statistics and other scenarios. In some cases, the banners will allow users to complete custom functions for a specific state or region.
Moving Around on the Map
The map is set initially for panning, meaning moving the center of the map while remaining at the same scale. Panning is accomplished by clicking on a point on the map, holding down on the mouse button, moving the cursor to another location, and then releasing the button. Alternately, on a touch screen or mobile device, users can pan by touching a point on the map, maintaining contact with the screen while moving their finger to a new location, and then releasing it. Zooming in, meaning changing the map to a larger scale, can be accomplished by the following methods:

- If your mouse has a scroll wheel, then turn the wheel upward (away from your body) to zoom in or downward to zoom out.
- Click on the plus and minus buttons at the top left of the map to zoom in and zoom out .
- Hold down the shift key on your keyboard and then draw a box by clicking at the location of a corner of where you want the box to be, holding down the mouse button while moving the mouse to the opposite corner of where you want the box to be, and then releasing the mouse button.
- On a touch screen or mobile device, use a pinching action to zoom out by touching the screen at two locations and then moving your fingers together to zoom in or moving them apart to zoom in.
- A location search option also is available, and is explained below.
Toward the bottom left of the Map Frame is a white text box that displays the current zoom level (between 1 and 20), the map scale ratio, and the latitude and longitude of the location at which the user’s cursor is pointing on the map. Initially, the map appears at zoom level 4. Below the text box is a scale bar, which indicates the length that is shown on the map for a given distance. As you zoom in and out, the displayed zoom level and map scale will change accordingly.
Displaying Layers and the Map Legend
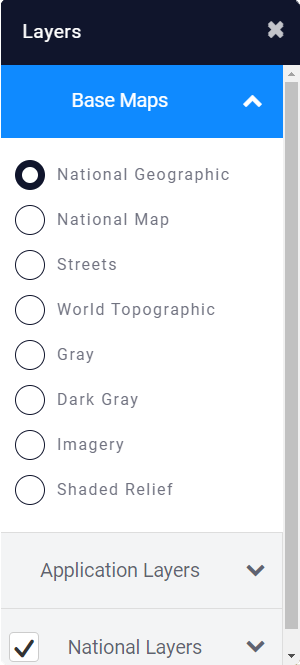
The Layers pane at the top right of the map is initially open to show the Base Maps and National Layers banners. Clicking on the X at the right of the black Layers banner will close the pane and replace it with a small icon. Clicking on the icon will cause the pane to reopen.
The Base Maps and National Layers banners have down arrowheads (∨) at the right side of each banner, and statespecific map layers. The state-specific map layers banner will appear only after the map is zoomed into at least zoom level 8 and a state is selected. The state-specific banner will be labeled as XX Map Layers, where XX is the 2-letter postal abbreviation for the selected state. A down arrowhead (∨) is at the right side of each banner.
Clicking anywhere on the Base Maps banner will cause it to turn blue and a list of available base map options will appear below it, with radio buttons to the left of each listed layer to allow selection of the base map to be displayed. Clicking again on the Base Maps banner will turn it gray again and the list of base maps will disappear.
Some layers do not appear in the map until it is zoomed into a minimum scale. For example, the streamgages will not appear until zoomed into zoom level 9, and the stream grid used to select points for delineating basin boundaries will not appear until zoomed into zoom level 15.
The National Layers banner has a check box on the left side and a down arrowhead (∨) at the right side of the banner. By default, the check box is checked, indicating that the nationally available layers will be displayed on the map when it is at zoom level 9 or greater. Clicking anywhere on the banner except on the down arrowhead (∨) at the right side of it will remove the check from the check box and disable the display of the national layers. Clicking on the down arrowhead will turn the banner blue and expose a 8 panel showing the layers that are available nationally and the symbols used on the map to display them. Clicking on the up arrowhead will collapse the list and turn the banner back to gray.
Each state and region has layers that are specific to the operation of the state’s or region’s application. These layers cannot be displayed until the state or region is selected in the Sidebar at a minimum of zoom level 8. After the state or region is selected, a banner for controlling the display of the layers that are available specifically that state is added to the Layers pane. The panel for a state will be named XX Map Layers, where XX is the 2- letter postal code for the selected state. The panel for a region, typically a river basin, will be named XXX Map Layers, where XXX is the first letter of the river basin name. For example, if the user selects Colorado, then the panel will be named CO Map Layers. This panel operates in the same manner as the National Layers panel. Each state and region has at least the StreamGrid and ExcludePolys layers available, but other layers may be available. ExcludePolys appear as hatched areas on the map. Functionality is limited in these areas. Warnings are provided in pop-ups on the map to explain the limitations when attempting to accomplish a task that is not allowed. Typically, it is not possible to delineate basins in these areas; however, sometimes delineations can be obtained but basin characteristics or flow statistics or both cannot be obtained for the delineated areas. Although the state layers panel appears after the state is selected at zoom level 8, the stream grid will not actually appear on the map and delineations will not be possible until zoom level 15.