
Beaufort Sea Data Visualizations
December 19, 2024
Media
Sources/Usage: Public Domain. View Media Details
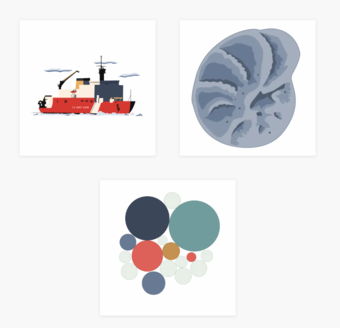
The Arctic Ocean is undergoing dramatic sea ice reduction and warming conditions. The researchers of this project use microfossils from sediment cores taken in the Beaufort Sea to rebuild the climate patterns, sea ice and circulation, and ecosystems from the past 2000 years. Three interactive data visualizations help tell this story:
- Beaufort Sea sediment coring
- Beaufort Sea microorganism species
- Beaufort Sea timeline
The Beaufort Sea data visualizations are part of the Earth in Flux chart gallery, which is a shared initiative between the USGS Water Mission Area and Ecosystems Mission Area to communicate key findings of USGS land change science in innovative ways, and to encourage creativity, exploration, and community in data visualization across USGS mission areas.
Related
Water Data Visualizations
Water data visualizations are provocative visuals and captivating stories that inform, inspire, and empower people to address our Nation's most pressing water issues. USGS data science and visualization experts use visualizations to communicate water data in compelling and often interactive ways when static images or written narrative can’t effectively communicate the interconnectivity and...

Land-Sea Linkages in the Arctic
The Arctic is undergoing historically unprecedented changes in weather, sea ice, temperature and ecosystems. These changes have led to greater coastal erosion, greater export of freshwater, and changes to marine and terrestrial ecosystems, habitats, and productivity, among other trends. Meanwhile, many believe the Arctic “amplifies” large climate changes during both warm periods and ice ages and...
Related
Water Data Visualizations
Water data visualizations are provocative visuals and captivating stories that inform, inspire, and empower people to address our Nation's most pressing water issues. USGS data science and visualization experts use visualizations to communicate water data in compelling and often interactive ways when static images or written narrative can’t effectively communicate the interconnectivity and...
Land-Sea Linkages in the Arctic
The Arctic is undergoing historically unprecedented changes in weather, sea ice, temperature and ecosystems. These changes have led to greater coastal erosion, greater export of freshwater, and changes to marine and terrestrial ecosystems, habitats, and productivity, among other trends. Meanwhile, many believe the Arctic “amplifies” large climate changes during both warm periods and ice ages and...