
USGS groundwater hydrologist, Bill Eldridge, is lowering a transducer into an observation well near Jewel Cave National Monument to monitor water-level changes in the Madison aquifer. The data collected will be used to update previously published groundwater-altitude maps to help better understand groundwater flow.
Images
Images intro.
Filter Total Items: 610

Groundwater-Level Measurement near Jewel Cave National Monument, SD
USGS groundwater hydrologist, Bill Eldridge, is lowering a transducer into an observation well near Jewel Cave National Monument to monitor water-level changes in the Madison aquifer. The data collected will be used to update previously published groundwater-altitude maps to help better understand groundwater flow.

Slush in Yellowstone River at Billings required old-school AA meter
Slush in Yellowstone River at Billings required old-school AA meter rather than ADCP which is typically used at this site.
Slush in Yellowstone River at Billings required old-school AA meter rather than ADCP which is typically used at this site.

Cutting through 2-ft thick ice to sample Yellowstone River, Sidney MT
Cutting through 2-ft thick ice to sample Yellowstone River, Sidney MT
Cutting through 2-ft thick ice to sample Yellowstone River, Sidney MT

Blackfeet Reservation Groundwater Monitoring Program Study Area Map
Blackfeet Reservation Groundwater Monitoring Program Study Area Map
Blackfeet Reservation Groundwater Monitoring Program Study Area Map

Mean annual streamflow permanence probability, Blackfoot Riv Basin
Mean annual streamflow permanence probability in a section of the Blackfoot River Basin near Deer Lodge, MT. Blue pixels indicate higher probability of streamflow permanence and red pixels indicate lower probability of streamflow permanence.
Mean annual streamflow permanence probability in a section of the Blackfoot River Basin near Deer Lodge, MT. Blue pixels indicate higher probability of streamflow permanence and red pixels indicate lower probability of streamflow permanence.

Stream observation points and focal basins for PROSPER project
Stream observation points and focal basins for PROSPER project
Stream observation points and focal basins for PROSPER project
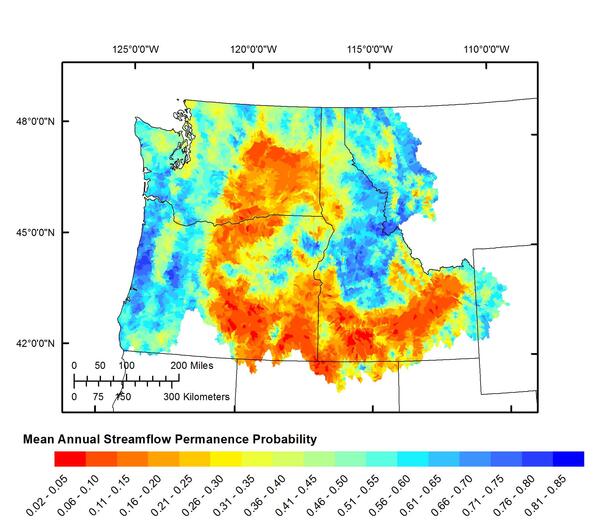
Mean annual streamflow permanence probability
Mean Annual Streamflow Permanence Probability
Mean Annual Streamflow Permanence Probability

Variability associated with streamflow permanence predictions
Variability associated with streamflow permanence predictions
Variability associated with streamflow permanence predictions

PROSPER classifications for a portion of the Little Blackfoot River ba
PROSPER classifications for a portion of the Little Blackfoot River basin near Deer Loddge, MT
PROSPER classifications for a portion of the Little Blackfoot River basin near Deer Loddge, MT

Hauling equipment to measure streamflow, Tongue River nr Decker
Hauling equipment to measure streamflow, Tongue River nr Decker
Hauling equipment to measure streamflow, Tongue River nr Decker

Streamflow Measurement Under Ice at Cheyenne River near Wasta, SD
During wintry conditions, streamflow is often measured under ice. This often means using an ice auger to cut holes through the ice, at increments across the full width of the stream.
During wintry conditions, streamflow is often measured under ice. This often means using an ice auger to cut holes through the ice, at increments across the full width of the stream.

Zero Streamflow at Souris River near Westhope, ND (05124000)
USGS hydrologic technicians Kevin Baker (shown in the picture) and Jarvis Kaderlik found the Souris River near Westhope, ND (streamgage 05124000) to be at zero flow on January 4, 2018.
USGS hydrologic technicians Kevin Baker (shown in the picture) and Jarvis Kaderlik found the Souris River near Westhope, ND (streamgage 05124000) to be at zero flow on January 4, 2018.

Rainbow Glacier perimeter: 1966, 1998, 2005, 2015.
This image shows the perimeter of Rainbow Glacier in Glacier National Park: 1966, 1998, 2005, 2015.
This image shows the perimeter of Rainbow Glacier in Glacier National Park: 1966, 1998, 2005, 2015.

Siyeh Glacier: upper - 2015 satellite photo, lower - 2005 aerial photo
Siyeh Glacier (upper – 2015 satellite photo, lower - 2005 aerial photo). The glacier margin is more clearly identified in the 2015 image because seasonal snow is persisting on the ice and rock debris atop the ice can be more clearly seen than in the heavily shaded 2005 image.
Siyeh Glacier (upper – 2015 satellite photo, lower - 2005 aerial photo). The glacier margin is more clearly identified in the 2015 image because seasonal snow is persisting on the ice and rock debris atop the ice can be more clearly seen than in the heavily shaded 2005 image.

Streamflow Measurements Under Ice Using Acoustic Doppler Technology
Hydrologic Technicians from USGS offices across North and South Dakota took part in training on how to make flow measurements under ice using acoustic Doppler technology. This technology increases measurement quality, while decreasing time, effort, and risk to the individuals making the measurements.
Hydrologic Technicians from USGS offices across North and South Dakota took part in training on how to make flow measurements under ice using acoustic Doppler technology. This technology increases measurement quality, while decreasing time, effort, and risk to the individuals making the measurements.

Scientist participating in snowmobile training in Montana.
Scientist participating in snowmobile training in Montana.
Scientist participating in snowmobile training in Montana.

Duck decoys
Close-up photo of several duck decoys and an adult Canvasback duck.
Waterfowl hunting’s annual economic footprint is over $3 billion.
Close-up photo of several duck decoys and an adult Canvasback duck.
Waterfowl hunting’s annual economic footprint is over $3 billion.

Sperry Glacier perimeter: 1966,1998, 2005, 2015.
This image shows the perimeter of Sperry Glacier in Glacier National Park in 1966,1998, 2005, and 2015.
This image shows the perimeter of Sperry Glacier in Glacier National Park in 1966,1998, 2005, and 2015.

Chaney Glacier perimeter: 1966, 1998, 2005, 2015.
This image shows the perimeter of Chaney Glacier in Glacier National Park in 1966, 1998, 2005, and 2015.
This image shows the perimeter of Chaney Glacier in Glacier National Park in 1966, 1998, 2005, and 2015.

Northern Cheyenne Indian Reservation study area
Northern Cheyenne Indian Reservation study area
Northern Cheyenne Indian Reservation study area