
A cutbank exposure near West DuNoir Creek, Wyoming, illustrates the differences between bedrock and surficial geologic mapping. On bedrock maps this location is mapped as the Eocene (55–34 million years old) Indian Meadows Formation, which corresponds to the bedrock visible in the stream bed.
Images
Images of Yellowstone.
Filter Total Items: 628

Cutbank exposure near West DuNoir Creek, Wyoming
A cutbank exposure near West DuNoir Creek, Wyoming, illustrates the differences between bedrock and surficial geologic mapping. On bedrock maps this location is mapped as the Eocene (55–34 million years old) Indian Meadows Formation, which corresponds to the bedrock visible in the stream bed.

Photo of a newly eroded cliff along the Gardner River, Yellowstone National Park
Photo of a newly eroded cliff along the Gardner River, Yellowstone National Park, showing the unconsolidated layers of sandstone and gravel. USGS photo by David Roth, September 5, 2022.
Photo of a newly eroded cliff along the Gardner River, Yellowstone National Park, showing the unconsolidated layers of sandstone and gravel. USGS photo by David Roth, September 5, 2022.

Gardner River chloride flux monitoring site before and after the June 2022 flooding in Yellowstone National Park
linkGardner River chloride flux monitoring site before and after the June 2022 flooding in Yellowstone National Park. (Left) Site prior to June 2022 storm. Note that the riverbank is near to the base of the fallen tree. USGS photo by Blaine McCleskey, May 21, 2014. (Right) Site after June 2022 storm. The probe is buried under ~4 feet of debris.

Method of rapidly cooling an experiment that involves molten rock
One method of rapidly cooling an experiment that involves molten rock. The volcanic material is dropped from inside the furnace (at ~1000 °C or 1830 °F!) down a vertical tube and into a bulb of room-temperature water.
One method of rapidly cooling an experiment that involves molten rock. The volcanic material is dropped from inside the furnace (at ~1000 °C or 1830 °F!) down a vertical tube and into a bulb of room-temperature water.

Sediment cores from Twin Butte Lake, Yellowstone National Park, being analyzed in the laboratory
linkSediment cores from Twin Butte Lake, Yellowstone National Park, being analyzed in the laboratory. (a) Photo of a freshly split core that exhibits a transition in lake productivity (grey sediment on bottom to dark organic rich sediment on top). One half of the core is scanned for multiple types of data and sampled while the other half of the core is archived.

Geologists examining a paleoseismic trench across the Sawtooth fault, Idaho
Photograph of geologists examining a paleoseismic trench across the Sawtooth fault, Idaho. Trenches like this provide geologists an opportunity to date sediments that were offset by past earthquakes, thus determining the rupture history of the fault. Photo by Zach Lifton, Idaho Geological Survey, September 2022.
Photograph of geologists examining a paleoseismic trench across the Sawtooth fault, Idaho. Trenches like this provide geologists an opportunity to date sediments that were offset by past earthquakes, thus determining the rupture history of the fault. Photo by Zach Lifton, Idaho Geological Survey, September 2022.

Landsat 8 thermal infrared images of Yellowstone showing daily and seasonal differences.
Landsat 8 thermal infrared images of Yellowstone showing daily and seasonal differences. In these greyscale images, bright pixels are warmer and dark pixels are cooler. In the daytime images (A and C), you can see the effects of topography, with darker (cooler) pixels like shadows on north-facing slopes and brighter (warmer) pixels on sun-facing slopes.&
Landsat 8 thermal infrared images of Yellowstone showing daily and seasonal differences. In these greyscale images, bright pixels are warmer and dark pixels are cooler. In the daytime images (A and C), you can see the effects of topography, with darker (cooler) pixels like shadows on north-facing slopes and brighter (warmer) pixels on sun-facing slopes.&

Dr. Cathy Whitlock on Twin Butte Lake, Yellowstone National Park, with a freshly extruded sediment core
linkDr. Cathy Whitlock (Montana State University) in the “core description boat” on Twin Butte Lake, Yellowstone National Park, with a freshly extruded one meter (3 feet) sediment core. Cores are described and measured in the field before being carefully wrapped for transport to the lab. Photo taken under NPS research permit YELL-2022-SCI-0009 by S.
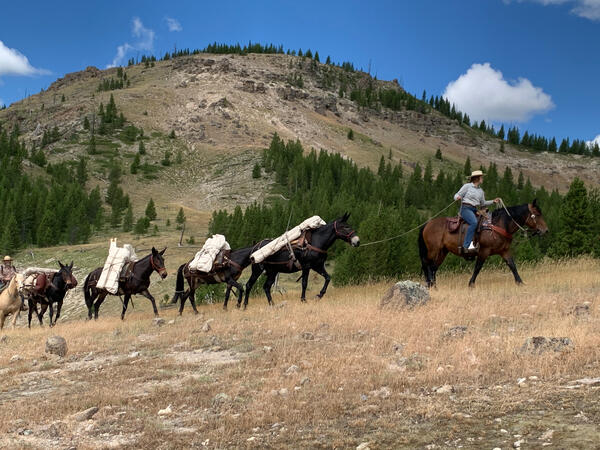
Pack mules carrying lake coring equipment to a small backcountry lake in Yellowstone National Park
linkA string of pack mules led by the National Park Service packers Hannah Miller and Ben Cunningham carrying lake coring equipment to a small backcountry lake in Yellowstone National Park; photo taken under NPS research permit YELL-2022-SCI-0009 by S. Hurwitz in August 2022.

Silica sinter breccia field along the Imperial Meadows Trail in the Lower Geyser Basin of Yellowstone National Park
linkExtensive silica sinter breccia field along the Imperial Meadows Trail in the Lower Geyser Basin of Yellowstone National Park looking southwest towards Twin Buttes. The inset image shows a place where a passing hiker’s footstep brushed away the white surface sinter, revealing bright green phototrophic microorganisms underneath (boot toe for scale).

Hillside Springs group at the margin of the Summit Lake post-caldera rhyolite lava flow in Upper Geyser Basin, Yellowstone National Park
linkHillside Springs group at the margin of the Summit Lake post-caldera rhyolite lava flow (the looming cliff) in Upper Geyser Basin, Yellowstone National Park. In the past few thousand years, the springs have occasionally deposited travertine, which can be found at the bottom of the hill below the active springs.

Lake coring operations at Twin Buttes Lake, Yellowstone National Park
Lake coring operations at Twin Buttes Lake, Yellowstone National Park, (a) Assembled lake coring platform being launched into the Twin Buttes Lake and (b) anchored in the core sampling location. Photos taken under NPS research permit YELL-2022-SCI-0009 by S. Hurwitz (a) and L. Harrison (b) in August 2022.
Lake coring operations at Twin Buttes Lake, Yellowstone National Park, (a) Assembled lake coring platform being launched into the Twin Buttes Lake and (b) anchored in the core sampling location. Photos taken under NPS research permit YELL-2022-SCI-0009 by S. Hurwitz (a) and L. Harrison (b) in August 2022.

Thermal images and accompanying photographs of hot areas on Firehole Lake Drive in Lower Geyser Basin, Yellowstone National Park
linkThermal images and accompanying photographs of hot areas on Firehole Lake Drive in Lower Geyser Basin, Yellowstone National Park. Top shows a hot pothole and deflected asphalt near Firehole Spring (images by Mark Wolf and Kiernan Folz-Donahue, July 13, 2022). Bottom shows thermal road damage between Great Fountain Geyser and White Dome Geyser, which is v

Field photograph showing the plateau-like nature of Timber Hill basalt
Field photograph showing the plateau-like nature of Timber Hill basalt. The Sweetwater Fault (yellow) vertically offsets the Timber Hill basalt at least 700 feet at this location. Photograph by Jesse Mosolf, Montana Bureau of Mines and Geology, 2022.
Field photograph showing the plateau-like nature of Timber Hill basalt. The Sweetwater Fault (yellow) vertically offsets the Timber Hill basalt at least 700 feet at this location. Photograph by Jesse Mosolf, Montana Bureau of Mines and Geology, 2022.

Boiling River, Yellowstone National Park, before and after the June 2022 flooding
Boiling River, Yellowstone National Park, before and after the June 2022 flooding. (Left) Visitors to Yellowstone National Park enjoy the warm waters of the Gardner River where it is joined by Boiling River, near Mammoth Hot Springs. Yellowstone National Park photo by Jim Peaco, July 30, 2014. (Right) Aerial view of Gardner River and Boiling River,
Boiling River, Yellowstone National Park, before and after the June 2022 flooding. (Left) Visitors to Yellowstone National Park enjoy the warm waters of the Gardner River where it is joined by Boiling River, near Mammoth Hot Springs. Yellowstone National Park photo by Jim Peaco, July 30, 2014. (Right) Aerial view of Gardner River and Boiling River,

Map of Yellowstone showing the location of seismic stations YSB and YUF as well as streamgages at Lamar River (LRG) and the Yellowstone River (YRG)
linkMap of Yellowstone showing the location of seismic stations YSB and YUF (yellow triangles) as well as the stream gages (red triangles) at Lamar River (LRG) and the Yellowstone River (YRG) at the outlet of Yellowstone Lake.

Discharge data from the Lamar River (red line) compared to seismic data recorded at station YSB in June 2022
linkDischarge data from the Lamar River (red line) compared to seismic data recorded at station YSB near Soda Butte Creek (a tributary of the Lamar River) during June 11–16, 2022.
Discharge data from the Lamar River (red line) compared to seismic data recorded at station YSB in June 2022
linkDischarge data from the Lamar River (red line) compared to seismic data recorded at station YSB near Soda Butte Creek (a tributary of the Lamar River) during June 11–16, 2022.

Discharge data from the Yellowstone River (red line) near the outlet of Yellowstone Lake compared to seismic data recorded at station YUF in June 2022
linkDischarge data from the Yellowstone River (red line) near the outlet of Yellowstone Lake compared to seismic data recorded at station YUF near the Upper Falls of the Yellowstone River during June 11–16, 2022.

Front cover of the Yellowstone Volcano Observatory’s Volcano and Earthquake Monitoring Plan for the Yellowstone Caldera System, 2022–2032
linkFront cover of the Yellowstone Volcano Observatory’s Volcano and Earthquake Monitoring Plan for the Yellowstone Caldera System, 2022–2032.

SNOTEL and streamgage sites in and around Yellowstone National Park
Map of SNOTEL snowpack telemetry sites (blue dots) and streamgages (red dots) in and around Yellowstone National Park.
Map of SNOTEL snowpack telemetry sites (blue dots) and streamgages (red dots) in and around Yellowstone National Park.

Yellowstone River level and discharge during June 9–16, 2022, at Corwin Springs streamgage north of Yellowstone National Park
linkYellowstone River level (left) and discharge (right) during June 9–16, 2022, measured at the Corwin Springs streamgage just north of Yellowstone National Park (https://waterdata.usgs.gov/mt/nwis/uv/?site_no=06191500&PARAmeter_cd=00065,00060,00010). The