
Two hydrologic technicians work on installing a monitoring station at War Branch. NWIS data for this site can be found here.
Images
Images from USGS Chesapeake Bay reports and field activities are available to visualize and help translate the science. They are available for your use, just please cite the USGS as the source of respective images.
Filter Total Items: 94

Monitoring Station Installation at War Branch
Two hydrologic technicians work on installing a monitoring station at War Branch. NWIS data for this site can be found here.

Hammer Creek
Hammer Creek is a creek in Lebanon County, Pennsylvania. Its 13 square mile watershed has a mixture of cropland and animal-raising activities.
Hammer Creek is a creek in Lebanon County, Pennsylvania. Its 13 square mile watershed has a mixture of cropland and animal-raising activities.

Hammer Creek
Hammer Creek is a creek in Lebanon County, Pennsylvania. Its 13 square mile watershed has a mixture of cropland and animal-raising activities.
Hammer Creek is a creek in Lebanon County, Pennsylvania. Its 13 square mile watershed has a mixture of cropland and animal-raising activities.

Hammer Creek
Hammer Creek is a creek in Lebanon County, Pennsylvania. Its 13 square mile watershed has a mixture of cropland and animal-raising activities.
Hammer Creek is a creek in Lebanon County, Pennsylvania. Its 13 square mile watershed has a mixture of cropland and animal-raising activities.

Hammer Creek
Hammer Creek is a creek in Lebanon County, Pennsylvania. Its 13 square mile watershed has a mixture of cropland and animal-raising activities.
Hammer Creek is a creek in Lebanon County, Pennsylvania. Its 13 square mile watershed has a mixture of cropland and animal-raising activities.

Little Conewago Creek
Little Conewago Creek is a creek in Lebanon County, Pennsylvania. Its 5 square mile watershed contains a mixture of animal and crop agricultural activities.
Little Conewago Creek is a creek in Lebanon County, Pennsylvania. Its 5 square mile watershed contains a mixture of animal and crop agricultural activities.

Graphical abstract showing phosphate discharged from the Susquehanna River to the Chesapeake Bay could be derived by desorpti
linkPhosphate discharged from the Susquehanna River to the Chesapeake Bay could be derived, in part, by desorption from legacy sediments accumulated in impoundments along the lower reaches of the river owing to increasing pH of the river water over recent decades.

Difficult Run monitoring station in Great Falls, VA
The stream gage at the Difficult Run Near Great Falls, VA monitoring station. This site is a part of the USGS Nontidal Network.
The stream gage at the Difficult Run Near Great Falls, VA monitoring station. This site is a part of the USGS Nontidal Network.

Water quality sondes at Difficult Run
Water quality monitoring sondes installed at Difficult Run Near Great Falls, VA. Part of the USGS nontidal network.
Water quality monitoring sondes installed at Difficult Run Near Great Falls, VA. Part of the USGS nontidal network.

Water Quality Sampling at Accotink Creek
A USGS hydrotech conducts horizontally-integrated synoptic water quality sampling at Accotink Creek Near Annandale, VA.
A USGS hydrotech conducts horizontally-integrated synoptic water quality sampling at Accotink Creek Near Annandale, VA.

Measuring water quality parameters at Accotink Creek
A USGS hydrotech uses a water quality sonde to measure conditions at Accotink Creek Near Annandale, VA. This monitoring station is part of the USGS nontidal network.
A USGS hydrotech uses a water quality sonde to measure conditions at Accotink Creek Near Annandale, VA. This monitoring station is part of the USGS nontidal network.

Accotink Creek near Annandale
Accotink Creek is an urban creek in the Potomac watershed. Like many urban streams, it suffers from bank erosion, leading to high suspended sediment loads, steep banks, and fallen trees.
Accotink Creek is an urban creek in the Potomac watershed. Like many urban streams, it suffers from bank erosion, leading to high suspended sediment loads, steep banks, and fallen trees.

Taking water quality samples from a bridge over an urban creek
A water quality sampling bottle used to collect samples from S F Quantico Creek Near Independent Hill, VA. This site is part of the USGS nontidal network.
A water quality sampling bottle used to collect samples from S F Quantico Creek Near Independent Hill, VA. This site is part of the USGS nontidal network.

Collecting water samples from the James River
A USGS hydrologist conducts horizontally-integrated synoptic water sampling of the James River at Cartersville as part of the USGS's nontidal network monitoring efforts.
A USGS hydrologist conducts horizontally-integrated synoptic water sampling of the James River at Cartersville as part of the USGS's nontidal network monitoring efforts.

Aerial imagery from Anne Arundel County, Maryland
The animation in the figure shows aerial imagery from Anne Arundel County, Maryland, collected by National Agricultural Imagery Program (NAIP), followed by 1-meter Chesapeake Bay Land Cover (13 classes) and Land Use/Land Cover (54 classes) data products.
The animation in the figure shows aerial imagery from Anne Arundel County, Maryland, collected by National Agricultural Imagery Program (NAIP), followed by 1-meter Chesapeake Bay Land Cover (13 classes) and Land Use/Land Cover (54 classes) data products.

Updated short-term nitrogen and phosphorous trends in the Chesapeake Bay
An illustration of updated short-term nitrogen and phosphorous trends in the Chesapeake Bay
An illustration of updated short-term nitrogen and phosphorous trends in the Chesapeake Bay

Trends in nitrogen, phosphorus, and suspended-sediment loads for RIM (2021)
Summary of long-term (1985-2021) and short-term (2012-2021) trends in nitrogen, phosphorus, and suspended-sediment loads for the River Input Monitoring stations. “Improving” or “Degrading” trends are classified as likelihood estimates greater than or equal to 67 percent, whereas “No trend” estimates are greater than 33 and less than 67 percent.
Summary of long-term (1985-2021) and short-term (2012-2021) trends in nitrogen, phosphorus, and suspended-sediment loads for the River Input Monitoring stations. “Improving” or “Degrading” trends are classified as likelihood estimates greater than or equal to 67 percent, whereas “No trend” estimates are greater than 33 and less than 67 percent.
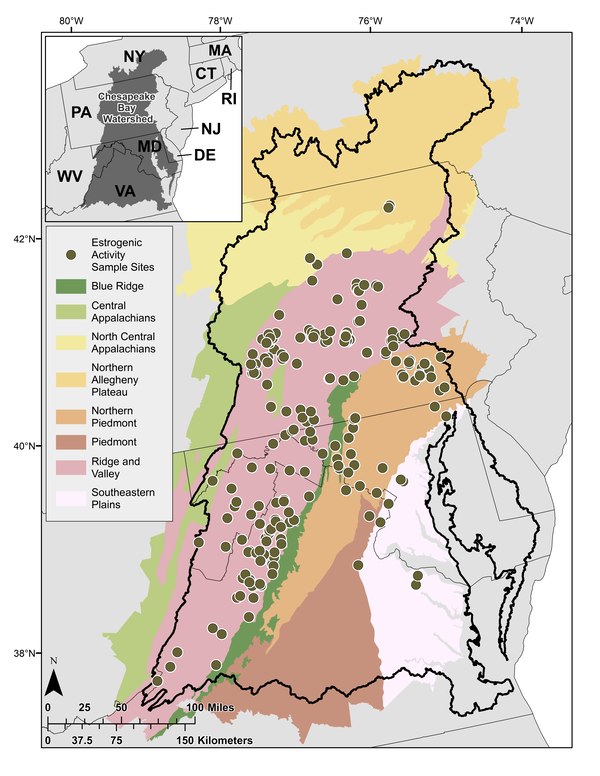
Map of surface water sampling locations in the Chesapeake Bay Watershed
Surface water sampling locations (n = 244) in the Chesapeake Bay Watershed shown with EPA Level 3 Ecoregions.
Surface water sampling locations (n = 244) in the Chesapeake Bay Watershed shown with EPA Level 3 Ecoregions.

Impairments in creeks caused by altered geomorphology and high nutrients from sedimentation and agricultural runoff
linkImpairments in Linganore Creek in Maryland (top) and Little Conestoga Creek in Pennsylvania (bottom) caused by altered geomorphology and high nutrients from sedimentation and agricultural runoff.

Lewes Survey
Jacob Mavrogeorge surveys in Lewers, Delaware.
Photo credit: Neel Hodgkinson/USGS Contractor
Jacob Mavrogeorge surveys in Lewers, Delaware.
Photo credit: Neel Hodgkinson/USGS Contractor

Collecting water quality samples from the New River Gorge
Collecting water quality samples from the New River Gorge in support of USGS-NPS partnership.
Fall 2022 Photo Contest Winner: Matt Kearns, USGS at Work category
Collecting water quality samples from the New River Gorge in support of USGS-NPS partnership.
Fall 2022 Photo Contest Winner: Matt Kearns, USGS at Work category