
Farmers have long known that not all areas in a field produce the same yield, yet the ability to measure and map this variability is a fairly recent arrival in agronomic management. The practice of measuring and mapping yield limiting variables throughout a field is generally referred to as zone mapping (Zhang and others, 2010). Zone maps are used to identify areas within a field that express a similar composition of one or more factors, including soil properties (structure, organic content, depth, and drainage), nutrient levels, topography (flatland, rolling hills), and historic crop growth and yield. A prerequisite to mapping these factors is the ability to accurately and consistently measure them at a high enough resolution to be able to rectify differences at the sub-field level. Multi-spectral sensors such as the Operational Land Imager (OLI) aboard Landsat 8 and the previous generation Enhanced Thematic Mapper Plus (ETM+) aboard Landsat 7 have proved exceptionally capable in this regard.
Farmers have long known that not all areas in a field produce the same yield, yet the ability to measure and map this variability is a fairly recent arrival in agronomic management. The practice of measuring and mapping yield limiting variables throughout a field is generally referred to as zone mapping (Zhang and others, 2010). Zone maps are used to identify areas within a field that express a similar composition of one or more factors, including soil properties (structure, organic content, depth, and drainage), nutrient levels, topography (flatland, rolling hills), and historic crop growth and yield. A prerequisite to mapping these factors is the ability to accurately and consistently measure them at a high enough resolution to be able to rectify differences at the sub-field level. Multi-spectral sensors such as the Operational Land Imager (OLI) aboard Landsat 8 and the previous generation Enhanced Thematic Mapper Plus (ETM+) aboard Landsat 7 have proved exceptionally capable in this regard. Additionally, both the OLI and ETM+ sensors collect imagery at 30-meter resolution for multispectral bands, which is sufficient for mapping variability at the field level. By utilizing different combinations of bands, it is possible to measure different environmental factors, particularly soil properties and vegetation status.
Zone Mapping Software
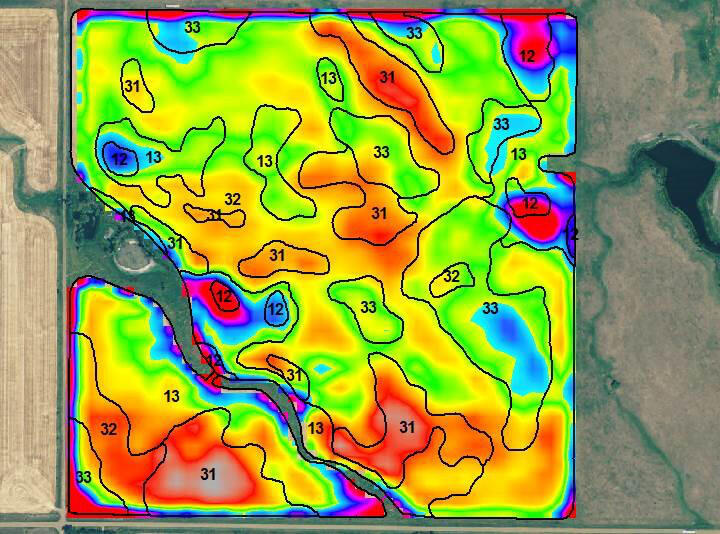
Used independently, data on field conditions such as soil properties, vegetation status, historic yield, and crop condition are of limited value (Doraiswamy and others, 2004). To fully realize the value of these data, they must be combined using specialized software. One example of this type of software is Ag Data Mapping Solution[1] (ADMS), produced by GK Technologies. ADMS is designed to manage and manipulate a range of geographic data, including the creation of zone maps from satellite imagery. Using a combination of bare soil and vegetation maps derived from Landsat imagery along with National Agriculture Imagery Program (NAIP) imagery and past yield data, zone maps can be created for a field (fig. 1) (Kelly Sharp, GK Technology, oral commun. and written commun., 2014). The specific type of zone map produced depends on the particular management action that is being targeted. For crops such as corn and soybean, primary crops in the rainfall-dependent Heartland region, zone maps are most often developed for variable rate (VR) application of fertilizer and seed.

While some agricultural cooperatives and consulting firms employ proprietary in-house software solutions, the ADMS software is available to for use by both independent crop consultants and producers. Currently, over 1000 customers are using the software independently to improve agricultural production through VR zoning, with the majority of customers in Minnesota, South Dakota, North Dakota, Pacific North West and Canada (Kelly Sharp, GK Technology, oral commun. and written commun., 2014).
Putting Zone Maps to Work
Availability of software like ADMS is allowing independent crop consultants such as Mark Foster and Jason Miller to supply agricultural consulting services to farmers throughout the South Dakota region. Both Foster and Miller utilize Landsat imagery along with other crop data inputs to develop VR maps for their clients.
Mark Foster currently develops VR maps for over 30,000 acres of corn. Using Landsat and NAIP imagery along with soils and historic yield data, he can develop prescription zone maps for VR fertilizer application (fig. 2). By using VR mapping, Foster can optimize fertilizer application based on productive variability throughout the field, with potential for cost savings or avoided losses. The degree of cost savings is highly dependent on the level of straight-rate fertilization that occurred prior to the adoption of VR application. If straight-rate fertilizer application was on average above optimal levels for field productivity, then users are likely to see at least some saving by switching to VR application. If straight-rate application was at or near average optimal levels, however, the redistribution of fertilizer between high and low productivity areas using VR application might result in minimal or no overall cost savings (Mark Foster, SD Consulting, oral commun. and written commun., 2014).
Ultimately, the goal of optimizing fertilizer application is to obtain high yields while minimizing loss either through the application of fertilizer and seed to poor soils or runoff and leaching due to over-application of fertilizer. To this end, Foster notes that in some cases, VR application may lead to an increase in fertilizer use as more aggressive yield quotas are set for high productivity areas. While this means that some clients do not necessarily see savings on overall fertilizer costs, they are not losing out by over applying fertilizer and seed to low productivity areas. However, the greater benefit of VR application for Foster’s clients is an increase in yield per/acre, generally on the order of 10%, which equates to an increase in revenue. According to Foster, “[Providing] this kind of critical [Landsat] data for variable rate application is very important work that the government is doing. Landsat imagery is critical for agriculture” (Mark Foster, SD Consulting, oral commun. and written commun., 2014).

Jason Miller is another independent crop consultant that has been using Landsat imagery to develop VR maps for clients since 2009, shortly after the imagery and historical archive became free. Currently, he manages around 50,000 acres and uses Landsat imagery along with on-the-ground soil testing to develop soil management plans for producers and managers. Based on soil characteristics, Miller develops management zones within fields (fig. 3) that are then used to develop VR zones for fertilizer and seed application. According to Miller, his clients see a mix of both cost savings and increases in revenue after implementing VR fertilizer and seed application. For example, corn and sunflowers respond extremely well to variable rate application of fertilizer and seed, with yield increases from 10-25%. Wheat also responds well, although at a slightly lower yield increase of 5-10% (Jason Miller, oral commun. and written commun., 2014).
Along with independent consultants, Landsat is utilized extensively for the development of variable-rate products by small consulting firms and farmer cooperatives. Hoffer Seeds, a crop consulting firm in South Dakota, has been using Landsat imagery followed by soil testing for the last six years to develop zone maps for over 80,000 acres. Jon Hofer, the owner of Hofer Seeds, says that producers see benefits from increased yield after switching to VR application. For corn, producers see on average a 6 to 12 bushel per acre increase. Wheat, which is slightly less responsive to VR application than corn, generally sees a 3 to 6 bushel per acre increase. However, wheat producers also see improvements in quality due to higher protein content. This both protects farmers against protein deficiency issues, and at times, depending on market demand, increases the price paid for higher quality wheat (Jon Hofer, Hofer Seeds, oral commun. and written commun., 2014).
Cooperatives such as North Central Farmers Elevator in South Dakota are reporting similar success with VR application. George Sperry, a Precision Ag Consultant with North Central Farmers Elevator, says that zone maps are created using Landsat imagery, verified through soil testing and finally an optimal level of fertilizer is calculated. By implementing VR application, producers see yield increases of 5 – 40 bushels per acre for corn and around 5 bushels per acre for wheat. Similar to customers of Hofer Seeds, North Central Farmers Elevator customers are also seeing increases in wheat quality (George Sperry, North Central Farmers Elevator, oral commun. and written commun., 2014).
While the use of Landsat imagery and development of VR zone maps is most often performed by crop consultants, it is increasingly being utilized directly by farm managers, such as Dan Forgey of Cronin Farms in South Dakota. Cronin Farms currently manages 22,000 acres of which 10,000 are farmed for wheat and corn while the remaining 12,000 are used for livestock pasture. Forgey had been using Landsat imagery to develop zone maps for VR application of fertilizer and has seen an increase in corn yield from roughly 120 to 155 bushels per acre (a 29% increase). Additionally, he is exploring the potential for Landsat to help guide livestock rotation on the remaining 12,000 acres. Rotational grazing affords a number of benefits including lower production costs (compared to confinement feed systems), improvements to soil quality, reduction of soil erosion, improvement of wildlife habitat, improved quality of life and reduction of disease. He anticipates that Landsat data will allow him to know exactly where to send cattle during rotation time, helping optimize their feed availability and allowing the pasture to regrow (Dan Forgey, Cronin Farms, SD, oral commun. and written commun., 2014).
For corn, wheat, and soy, increasing yield through higher overall biomass per acre is the primary method for increasing revenue. However, for some crops, such as sugar beets, the value is determined not based on biomass, but rather on the content (sugar in this case) of the beet itself. For sugar beets, as for many crops, nitrogen is an important nutrient for growth. Over-application of nitrogen, however, will cause excessive growth and low sugar content, which may result in an inferior grade beet with lower market value (Davis and Westfall 2009). To address this issue, Gary Wagner of AWG Farms in Minnesota has been using Landsat since 1997 to monitor nitrogen content in beet leaves (fig. 4). During sugar beet harvest, the stalks are left in the field and deposit nitrogen back into the soil during tillage. Landsat imagery allows Wagner to monitor nitrogen levels during the growing season as well estimate the amount of nitrogen going back into the soil after harvest. Using global positioning system (GPS) enabled applicators, Wagner can automate the application of any additional fertilizer. According to Wagner, this method of application saves AWG Farms 60-70 pounds of nitrogen per acre. Additionally it reduces environmental impact through nutrient runoff and leaching due to over application of fertilizer (Gary Wagner, AWG Farms, MN, oral commun. and written commun., 2014).

Increasing Yield
For producers in the Heartland and Northern Great Plains farm regions, as in many parts of the United States, availability of new or fallow land for cultivation is virtually non-existent and revenue is now primarily determined through yield per acre and price. Tracking market price and timing the sale of crops is challenging, leaving crop yield and in some cases crop quality as the primary mechanisms for increasing revenue. Achieving optimal yield by adjusting fertilizer and seed through VR application currently offers the most viable solution to producers.
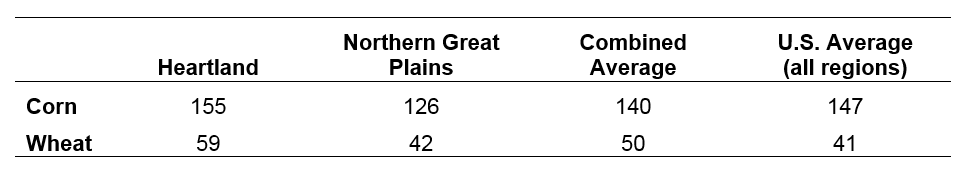
All users profiled in this study reported seeing increases in yield and/or quality after moving from straight-rate to variable rate application of fertilizer and seed. For corn, yield increases ranged from 5 to as high as 40 bushels per acre. Given a US marketing 5-year average price[1] of $5.18 per bushel of corn estimated revenue gains would range from roughly $25 to $200 per acre. Wheat producers reported yield increases of 3 to 6 bushels per acre. Using US marketing year average price[2] of $6.40 per bushel of wheat over the last five years, estimated revenue gains would range from $19 to $38 per acre on average. Five-year US yield averages are around 147 bushels per acre for corn, and 41 bushels per acre for wheat. Regional combined yield averages for the Heartland and Northern Great Plains farm regions are slightly lower than the US average for corn (140 bushels per acre) and slightly higher for wheat (50 bushels per acre) (table 1).
Improving the management of inputs, particularly fertilizer and seed, is becoming an increasingly important consideration, as these inputs represent a growing portion of operating costs of production, particularly for corn (fig. 5). While no case studies were able to provide exact figures on savings or avoided losses for inputs, almost all mentioned optimizing use of fertilizer and seed to increase yield as important factors in considering adoption and benefit of VR application.

References
Davis, J. G., and Westfall, D. G., 2009, Fertilizing sugar beets: Colorado State University Extension Services, http://www.ext.colostate.edu/pubs/crops/00542.pdf.
Doraiswamy, P. C., Hatfield, J.L., Jackson, T. J., Akhmedov, B., Prueger, J., and Stern, A., 2004, Crop condition and yield simulations using Landsat and MODIS: Remote Sensing of Environment, 2002 Soil Moisture Experiment (SMEX02), v. 92, no. 4, p. 548–559. doi:10.1016/j.rse.2004.05.017.
Zhang, X., Shi, L., Jia, X., Seielstad, G., and Helgason, C., 2010, Zone mapping Application for precision-farming: A decision support tool for variable rate application: Precision Agriculture, v. 11, no. 2, p. 103–114.

Case Studies of Landsat Imagery Use
Farmers have long known that not all areas in a field produce the same yield, yet the ability to measure and map this variability is a fairly recent arrival in agronomic management. The practice of measuring and mapping yield limiting variables throughout a field is generally referred to as zone mapping (Zhang and others, 2010). Zone maps are used to identify areas within a field that express a similar composition of one or more factors, including soil properties (structure, organic content, depth, and drainage), nutrient levels, topography (flatland, rolling hills), and historic crop growth and yield. A prerequisite to mapping these factors is the ability to accurately and consistently measure them at a high enough resolution to be able to rectify differences at the sub-field level. Multi-spectral sensors such as the Operational Land Imager (OLI) aboard Landsat 8 and the previous generation Enhanced Thematic Mapper Plus (ETM+) aboard Landsat 7 have proved exceptionally capable in this regard.
Farmers have long known that not all areas in a field produce the same yield, yet the ability to measure and map this variability is a fairly recent arrival in agronomic management. The practice of measuring and mapping yield limiting variables throughout a field is generally referred to as zone mapping (Zhang and others, 2010). Zone maps are used to identify areas within a field that express a similar composition of one or more factors, including soil properties (structure, organic content, depth, and drainage), nutrient levels, topography (flatland, rolling hills), and historic crop growth and yield. A prerequisite to mapping these factors is the ability to accurately and consistently measure them at a high enough resolution to be able to rectify differences at the sub-field level. Multi-spectral sensors such as the Operational Land Imager (OLI) aboard Landsat 8 and the previous generation Enhanced Thematic Mapper Plus (ETM+) aboard Landsat 7 have proved exceptionally capable in this regard. Additionally, both the OLI and ETM+ sensors collect imagery at 30-meter resolution for multispectral bands, which is sufficient for mapping variability at the field level. By utilizing different combinations of bands, it is possible to measure different environmental factors, particularly soil properties and vegetation status.
Zone Mapping Software
Used independently, data on field conditions such as soil properties, vegetation status, historic yield, and crop condition are of limited value (Doraiswamy and others, 2004). To fully realize the value of these data, they must be combined using specialized software. One example of this type of software is Ag Data Mapping Solution[1] (ADMS), produced by GK Technologies. ADMS is designed to manage and manipulate a range of geographic data, including the creation of zone maps from satellite imagery. Using a combination of bare soil and vegetation maps derived from Landsat imagery along with National Agriculture Imagery Program (NAIP) imagery and past yield data, zone maps can be created for a field (fig. 1) (Kelly Sharp, GK Technology, oral commun. and written commun., 2014). The specific type of zone map produced depends on the particular management action that is being targeted. For crops such as corn and soybean, primary crops in the rainfall-dependent Heartland region, zone maps are most often developed for variable rate (VR) application of fertilizer and seed.
While some agricultural cooperatives and consulting firms employ proprietary in-house software solutions, the ADMS software is available to for use by both independent crop consultants and producers. Currently, over 1000 customers are using the software independently to improve agricultural production through VR zoning, with the majority of customers in Minnesota, South Dakota, North Dakota, Pacific North West and Canada (Kelly Sharp, GK Technology, oral commun. and written commun., 2014).
Putting Zone Maps to Work
Availability of software like ADMS is allowing independent crop consultants such as Mark Foster and Jason Miller to supply agricultural consulting services to farmers throughout the South Dakota region. Both Foster and Miller utilize Landsat imagery along with other crop data inputs to develop VR maps for their clients.
Mark Foster currently develops VR maps for over 30,000 acres of corn. Using Landsat and NAIP imagery along with soils and historic yield data, he can develop prescription zone maps for VR fertilizer application (fig. 2). By using VR mapping, Foster can optimize fertilizer application based on productive variability throughout the field, with potential for cost savings or avoided losses. The degree of cost savings is highly dependent on the level of straight-rate fertilization that occurred prior to the adoption of VR application. If straight-rate fertilizer application was on average above optimal levels for field productivity, then users are likely to see at least some saving by switching to VR application. If straight-rate application was at or near average optimal levels, however, the redistribution of fertilizer between high and low productivity areas using VR application might result in minimal or no overall cost savings (Mark Foster, SD Consulting, oral commun. and written commun., 2014).
Ultimately, the goal of optimizing fertilizer application is to obtain high yields while minimizing loss either through the application of fertilizer and seed to poor soils or runoff and leaching due to over-application of fertilizer. To this end, Foster notes that in some cases, VR application may lead to an increase in fertilizer use as more aggressive yield quotas are set for high productivity areas. While this means that some clients do not necessarily see savings on overall fertilizer costs, they are not losing out by over applying fertilizer and seed to low productivity areas. However, the greater benefit of VR application for Foster’s clients is an increase in yield per/acre, generally on the order of 10%, which equates to an increase in revenue. According to Foster, “[Providing] this kind of critical [Landsat] data for variable rate application is very important work that the government is doing. Landsat imagery is critical for agriculture” (Mark Foster, SD Consulting, oral commun. and written commun., 2014).
Jason Miller is another independent crop consultant that has been using Landsat imagery to develop VR maps for clients since 2009, shortly after the imagery and historical archive became free. Currently, he manages around 50,000 acres and uses Landsat imagery along with on-the-ground soil testing to develop soil management plans for producers and managers. Based on soil characteristics, Miller develops management zones within fields (fig. 3) that are then used to develop VR zones for fertilizer and seed application. According to Miller, his clients see a mix of both cost savings and increases in revenue after implementing VR fertilizer and seed application. For example, corn and sunflowers respond extremely well to variable rate application of fertilizer and seed, with yield increases from 10-25%. Wheat also responds well, although at a slightly lower yield increase of 5-10% (Jason Miller, oral commun. and written commun., 2014).
Along with independent consultants, Landsat is utilized extensively for the development of variable-rate products by small consulting firms and farmer cooperatives. Hoffer Seeds, a crop consulting firm in South Dakota, has been using Landsat imagery followed by soil testing for the last six years to develop zone maps for over 80,000 acres. Jon Hofer, the owner of Hofer Seeds, says that producers see benefits from increased yield after switching to VR application. For corn, producers see on average a 6 to 12 bushel per acre increase. Wheat, which is slightly less responsive to VR application than corn, generally sees a 3 to 6 bushel per acre increase. However, wheat producers also see improvements in quality due to higher protein content. This both protects farmers against protein deficiency issues, and at times, depending on market demand, increases the price paid for higher quality wheat (Jon Hofer, Hofer Seeds, oral commun. and written commun., 2014).
Cooperatives such as North Central Farmers Elevator in South Dakota are reporting similar success with VR application. George Sperry, a Precision Ag Consultant with North Central Farmers Elevator, says that zone maps are created using Landsat imagery, verified through soil testing and finally an optimal level of fertilizer is calculated. By implementing VR application, producers see yield increases of 5 – 40 bushels per acre for corn and around 5 bushels per acre for wheat. Similar to customers of Hofer Seeds, North Central Farmers Elevator customers are also seeing increases in wheat quality (George Sperry, North Central Farmers Elevator, oral commun. and written commun., 2014).
While the use of Landsat imagery and development of VR zone maps is most often performed by crop consultants, it is increasingly being utilized directly by farm managers, such as Dan Forgey of Cronin Farms in South Dakota. Cronin Farms currently manages 22,000 acres of which 10,000 are farmed for wheat and corn while the remaining 12,000 are used for livestock pasture. Forgey had been using Landsat imagery to develop zone maps for VR application of fertilizer and has seen an increase in corn yield from roughly 120 to 155 bushels per acre (a 29% increase). Additionally, he is exploring the potential for Landsat to help guide livestock rotation on the remaining 12,000 acres. Rotational grazing affords a number of benefits including lower production costs (compared to confinement feed systems), improvements to soil quality, reduction of soil erosion, improvement of wildlife habitat, improved quality of life and reduction of disease. He anticipates that Landsat data will allow him to know exactly where to send cattle during rotation time, helping optimize their feed availability and allowing the pasture to regrow (Dan Forgey, Cronin Farms, SD, oral commun. and written commun., 2014).
For corn, wheat, and soy, increasing yield through higher overall biomass per acre is the primary method for increasing revenue. However, for some crops, such as sugar beets, the value is determined not based on biomass, but rather on the content (sugar in this case) of the beet itself. For sugar beets, as for many crops, nitrogen is an important nutrient for growth. Over-application of nitrogen, however, will cause excessive growth and low sugar content, which may result in an inferior grade beet with lower market value (Davis and Westfall 2009). To address this issue, Gary Wagner of AWG Farms in Minnesota has been using Landsat since 1997 to monitor nitrogen content in beet leaves (fig. 4). During sugar beet harvest, the stalks are left in the field and deposit nitrogen back into the soil during tillage. Landsat imagery allows Wagner to monitor nitrogen levels during the growing season as well estimate the amount of nitrogen going back into the soil after harvest. Using global positioning system (GPS) enabled applicators, Wagner can automate the application of any additional fertilizer. According to Wagner, this method of application saves AWG Farms 60-70 pounds of nitrogen per acre. Additionally it reduces environmental impact through nutrient runoff and leaching due to over application of fertilizer (Gary Wagner, AWG Farms, MN, oral commun. and written commun., 2014).
Increasing Yield
For producers in the Heartland and Northern Great Plains farm regions, as in many parts of the United States, availability of new or fallow land for cultivation is virtually non-existent and revenue is now primarily determined through yield per acre and price. Tracking market price and timing the sale of crops is challenging, leaving crop yield and in some cases crop quality as the primary mechanisms for increasing revenue. Achieving optimal yield by adjusting fertilizer and seed through VR application currently offers the most viable solution to producers.
All users profiled in this study reported seeing increases in yield and/or quality after moving from straight-rate to variable rate application of fertilizer and seed. For corn, yield increases ranged from 5 to as high as 40 bushels per acre. Given a US marketing 5-year average price[1] of $5.18 per bushel of corn estimated revenue gains would range from roughly $25 to $200 per acre. Wheat producers reported yield increases of 3 to 6 bushels per acre. Using US marketing year average price[2] of $6.40 per bushel of wheat over the last five years, estimated revenue gains would range from $19 to $38 per acre on average. Five-year US yield averages are around 147 bushels per acre for corn, and 41 bushels per acre for wheat. Regional combined yield averages for the Heartland and Northern Great Plains farm regions are slightly lower than the US average for corn (140 bushels per acre) and slightly higher for wheat (50 bushels per acre) (table 1).
Improving the management of inputs, particularly fertilizer and seed, is becoming an increasingly important consideration, as these inputs represent a growing portion of operating costs of production, particularly for corn (fig. 5). While no case studies were able to provide exact figures on savings or avoided losses for inputs, almost all mentioned optimizing use of fertilizer and seed to increase yield as important factors in considering adoption and benefit of VR application.
References
Davis, J. G., and Westfall, D. G., 2009, Fertilizing sugar beets: Colorado State University Extension Services, http://www.ext.colostate.edu/pubs/crops/00542.pdf.
Doraiswamy, P. C., Hatfield, J.L., Jackson, T. J., Akhmedov, B., Prueger, J., and Stern, A., 2004, Crop condition and yield simulations using Landsat and MODIS: Remote Sensing of Environment, 2002 Soil Moisture Experiment (SMEX02), v. 92, no. 4, p. 548–559. doi:10.1016/j.rse.2004.05.017.
Zhang, X., Shi, L., Jia, X., Seielstad, G., and Helgason, C., 2010, Zone mapping Application for precision-farming: A decision support tool for variable rate application: Precision Agriculture, v. 11, no. 2, p. 103–114.