
USGS hydrologic technician Virginia Stanley is towing an acoustic doppler current profiler (ADCP) behind a kayak on the Quinebaug River in Putnam, Connecticut, to capture streamflow measurements.
Images
Click through our gallery of photographs showcasing New England Water Science Center research projects and monitoring work throughout the region.
Filter Total Items: 518

USGS Hydrologic Technician Tows ADCP behind Kayak on Quinebaug River in Connecticut
USGS hydrologic technician Virginia Stanley is towing an acoustic doppler current profiler (ADCP) behind a kayak on the Quinebaug River in Putnam, Connecticut, to capture streamflow measurements.

Putting Together Metal Enclosures for Groundwater Gage
USGS staff outfit the inside of the metal enclosures for groundwater wells. These enclosures contain data loggers, sensor, battery and telemetry equipment that transit the real-time data collected at the well.
USGS staff outfit the inside of the metal enclosures for groundwater wells. These enclosures contain data loggers, sensor, battery and telemetry equipment that transit the real-time data collected at the well.

Hydrologic Technician Nathan Roy testing ice thickness prior to collecting a water quality sample
linkHydrologic Technician Nathan Roy testing ice thickness prior to collecting a water quality sample in West Hartford, VT.
Winter 2025 Photo Contest Winner: Danny Hansen, Honorable Mention category
Hydrologic Technician Nathan Roy testing ice thickness prior to collecting a water quality sample
linkHydrologic Technician Nathan Roy testing ice thickness prior to collecting a water quality sample in West Hartford, VT.
Winter 2025 Photo Contest Winner: Danny Hansen, Honorable Mention category

Measuring discharge at Wilbur Hollow Brook, Rhode Island
Hydrologic technician measuring discharge for nutrient load calculations at Wilbur Hollow Brook near Clayville, RI.
Hydrologic technician measuring discharge for nutrient load calculations at Wilbur Hollow Brook near Clayville, RI.

National Water Quality Network (NWQN) discrete water quality sample collection, Connecticut River
linkNational Water Quality Network (NWQN) discrete water quality sample collection. Paul Solis (Left) Samantha Robinson (Right) driving to location on boat on the Connecticut River near Thompsonville, Connecticut.
Winter 2025 Photo Contest Winner: Allen Lyon, Honorable Mention

Physical Scientist Presents Research at AGU24
Physical Scientist Andrew Collins, of the USGS New England Water Science Center, presents his research on PFAS contamination in coastal kettle lake and bog systems at AGU24. Collins uses multiscale groundwater-flow modeling to see how flow paths influence the distribution of PFAS contaminants.
Physical Scientist Andrew Collins, of the USGS New England Water Science Center, presents his research on PFAS contamination in coastal kettle lake and bog systems at AGU24. Collins uses multiscale groundwater-flow modeling to see how flow paths influence the distribution of PFAS contaminants.

Poster Session at AGU24
A look at the section of poster presentations at AGU24, the American Geophysical Union's annual conference. The 2024 conference took place at the Walter E. Washington Convention Center in Washington, D.C.
A look at the section of poster presentations at AGU24, the American Geophysical Union's annual conference. The 2024 conference took place at the Walter E. Washington Convention Center in Washington, D.C.

AGU24 Poster Session
USGS New England Water Science Center Physical Scientist Sarah Murphy presents her research during a poster session at AGU24 alongside co-author Chris Cook of the U.S. Army Corps of Engineers.
USGS New England Water Science Center Physical Scientist Sarah Murphy presents her research during a poster session at AGU24 alongside co-author Chris Cook of the U.S. Army Corps of Engineers.
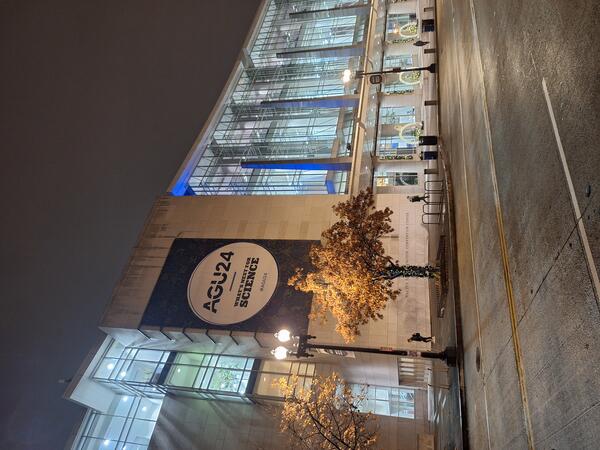
AGU24 Held at Walter E. Washington Convention Center in Washington D.C.
The American Geophysical Union held their annual conference in Washington D.C. the second week of December in 2024.
The American Geophysical Union held their annual conference in Washington D.C. the second week of December in 2024.

Research Hydrologist Presents Science at AGU24
USGS Research Hydrologist Glenn Hodgkins presents his work on extreme low streamflows in North and South America, Europe and Australia and the climatic factors that drive them at AGU24 in Washington D.C.
USGS Research Hydrologist Glenn Hodgkins presents his work on extreme low streamflows in North and South America, Europe and Australia and the climatic factors that drive them at AGU24 in Washington D.C.

Hydrologist Presents Groundwater Modeling Research at AGU24
USGS New England Water Science Center Hydrologist Janet Barclay presents her research at AGU24. She calculated the amount of groundwater-transported nitrogen entering Long Island Sound from Connecticut.
USGS New England Water Science Center Hydrologist Janet Barclay presents her research at AGU24. She calculated the amount of groundwater-transported nitrogen entering Long Island Sound from Connecticut.

Long Island Sound Nitrogen Loading Dashboard Image
A screen capture of an interactive web application that displays Nitrogen Loading from Selected Long Island Sound Tributaries from 1995 to 2021.
A screen capture of an interactive web application that displays Nitrogen Loading from Selected Long Island Sound Tributaries from 1995 to 2021.

Vermont Flood Data Viewer
Image of the Vermont flood event viewer comparing high-water mark from a 2023 flood event to Tropical Storm Irene in 2011.
Image of the Vermont flood event viewer comparing high-water mark from a 2023 flood event to Tropical Storm Irene in 2011.

Probability for PFAS in groundwater at the depth of private drinking water supply
USGS national estimates of the probability for PFAS in groundwater at the depth of private drinking water supply. Read the associated USGS study at https://doi.org/10.1126/science.ado6638.
USGS national estimates of the probability for PFAS in groundwater at the depth of private drinking water supply. Read the associated USGS study at https://doi.org/10.1126/science.ado6638.

Probability for PFAS in groundwater at the depth of public drinking water supply
USGS national estimates of the probability for PFAS in groundwater at the depth of public drinking water supply. Read the associated USGS study at https://doi.org/10.1126/science.ado6638.
USGS national estimates of the probability for PFAS in groundwater at the depth of public drinking water supply. Read the associated USGS study at https://doi.org/10.1126/science.ado6638.

Ribbon Cutting of USGS Connecticut Office
The USGS New England Water Science Center co-located their Connecticut office to the campus of Goodwin University in 2023. The university hosted an official ribbon cutting of the new facility in October 2024 with federal, state, and local politicians attending and sharing their well wishes.
The USGS New England Water Science Center co-located their Connecticut office to the campus of Goodwin University in 2023. The university hosted an official ribbon cutting of the new facility in October 2024 with federal, state, and local politicians attending and sharing their well wishes.

Ribbon Cutting at USGS Office at Goodwin University
USGS New England Water Science Center Deputy Director holds a certificate from the General Assembly of the State of Connecticut.
USGS New England Water Science Center Deputy Director holds a certificate from the General Assembly of the State of Connecticut.

USGS Interpretive Sign on Nutrient Loading in Academy Cove in North Kingston, Rhode Island
An interpretive sign put together by USGS about research on nutrient pollution entering into the coastal waters near Wickford, Rhode Island.
An interpretive sign put together by USGS about research on nutrient pollution entering into the coastal waters near Wickford, Rhode Island.

USGS Interpretive Sign on Nutrient Pollution Entering Rhode Island Coastal Waters
An interpretive sign put together by USGS about research on nutrient pollution entering into Academy Cove in North Kingston, Rhode Island, and affecting coastal waters.
An interpretive sign put together by USGS about research on nutrient pollution entering into Academy Cove in North Kingston, Rhode Island, and affecting coastal waters.

Annual Groundwater-Transported Nitrogen Yield into Long Island Sound
A map of Connecticut showing the annual groundwater-transported nitrogen yield on the north shore of the Long Island Sound. Watersheds that have yields exceeding 500 kilograms of nitrogen per square kilometer per year are shown in yellow regardless of the magnitude of the yield.
A map of Connecticut showing the annual groundwater-transported nitrogen yield on the north shore of the Long Island Sound. Watersheds that have yields exceeding 500 kilograms of nitrogen per square kilometer per year are shown in yellow regardless of the magnitude of the yield.