
Regional land area/bathymetric map including submarine landslides, headwall scarps, and mass wasting zones compiled and mapped offshore of southern California for the study A comprehensive assessment of submarine landslides and mass wasting processes offshore southern California.
Multimedia
Images

Map showing location of mapped submarine landslides off the southern California coast
Regional land area/bathymetric map including submarine landslides, headwall scarps, and mass wasting zones compiled and mapped offshore of southern California for the study A comprehensive assessment of submarine landslides and mass wasting processes offshore southern California.

Diagram of the San Nicolas submarine landslide off the southern California coast
San Nicolas slide.

Map showing aftershock zones of great Aleutian Islands earthquakes in the 20th century
Map showing aftershock zones of great Aleutian Islands, Alaska, earthquakes in the 20th century. Red solid line with pink fill indicates aftershock zone of the 1957 Aleutian Islands earthquake from Sykes et al.
Map showing aftershock zones of great Aleutian Islands, Alaska, earthquakes in the 20th century. Red solid line with pink fill indicates aftershock zone of the 1957 Aleutian Islands earthquake from Sykes et al.

Animated GIF of Aleutian Islands 1957 tsunami simulation
Animated GIF of a simulation of the Aleutian Islands, Alaska 1957 magnitude 8.6 tsunami.
Animated GIF of a simulation of the Aleutian Islands, Alaska 1957 magnitude 8.6 tsunami.

Cover image for timelapse at the Elwha River Mouth on the Olympic Peninsula in Washington.
Cover image for timelapse at the Elwha River Mouth on the Olympic Peninsula in Washington.
Cover image for timelapse at the Elwha River Mouth on the Olympic Peninsula in Washington.

Elwha River Mouth flyover and timelapse cover image
Cover image for flyover and timelapse at the Elwha River Mouth on the Olympic Peninsula in Washington.
Cover image for flyover and timelapse at the Elwha River Mouth on the Olympic Peninsula in Washington.
Videos
Elwha River Mouth virtual flyover and timelapse
This PlaneCam video was produced by developing animation tracklines in ArcGlobe, using imagery from PlaneCam flights.
This PlaneCam video was produced by developing animation tracklines in ArcGlobe, using imagery from PlaneCam flights.

Lake Mills Delta timelapse
Timelapsed photo data is sequenced at about 1 pixel-averaged frame per day, meaning that all of the images from a given day are combined, and the RGB values for a given x/y location on the image are the average of every RGB value for that location for that day.
Timelapsed photo data is sequenced at about 1 pixel-averaged frame per day, meaning that all of the images from a given day are combined, and the RGB values for a given x/y location on the image are the average of every RGB value for that location for that day.
Elwha River Mouth timelapse
This PlaneCam video was produced by developing animation tracklines in ArcGlobe, using imagery from PlaneCam flights.
This PlaneCam video was produced by developing animation tracklines in ArcGlobe, using imagery from PlaneCam flights.

Glines Canyon Dam timelapse
Timelapsed photo data is sequenced at about 1 pixel-averaged frame per day, meaning that all of the images from a given day are combined, and the RGB values for a given x/y location on the image are the average of every RGB value for that location for that day.
Timelapsed photo data is sequenced at about 1 pixel-averaged frame per day, meaning that all of the images from a given day are combined, and the RGB values for a given x/y location on the image are the average of every RGB value for that location for that day.

Lake Aldwell Delta timelapse
Timelapsed photo data is sequenced at about 1 pixel-averaged frame per day, meaning that all of the images from a given day are combined, and the RGB values for a given x/y location on the image are the average of every RGB value for that location for that day.
Timelapsed photo data is sequenced at about 1 pixel-averaged frame per day, meaning that all of the images from a given day are combined, and the RGB values for a given x/y location on the image are the average of every RGB value for that location for that day.

Lower Lake Aldwell timelapse
Timelapsed photo data is sequenced at about 1 pixel-averaged frame per day, meaning that all of the images from a given day are combined, and the RGB values for a given x/y location on the image are the average of every RGB value for that location for that day.
Timelapsed photo data is sequenced at about 1 pixel-averaged frame per day, meaning that all of the images from a given day are combined, and the RGB values for a given x/y location on the image are the average of every RGB value for that location for that day.
Webcams

Nuvuk video camera 2 bright image
Two video cameras are installed atop a utility pole near the northernmost point of land in the United States at Nuvuk (Point Barrow), Alaska. The cameras point northwest toward the Arctic Ocean and the boundary between the Chukchi and Beaufort Seas. Every half hour during daylight hours, the cameras collect snapshots and video for 10 minutes.
Two video cameras are installed atop a utility pole near the northernmost point of land in the United States at Nuvuk (Point Barrow), Alaska. The cameras point northwest toward the Arctic Ocean and the boundary between the Chukchi and Beaufort Seas. Every half hour during daylight hours, the cameras collect snapshots and video for 10 minutes.

Nuvuk video camera 1 dark image
Two video cameras are installed atop a utility pole near the northernmost point of land in the United States at Nuvuk (Point Barrow), Alaska. The cameras point northwest toward the Arctic Ocean and the boundary between the Chukchi and Beaufort Seas. Every half hour during daylight hours, the cameras collect snapshots and video for 10 minutes.
Two video cameras are installed atop a utility pole near the northernmost point of land in the United States at Nuvuk (Point Barrow), Alaska. The cameras point northwest toward the Arctic Ocean and the boundary between the Chukchi and Beaufort Seas. Every half hour during daylight hours, the cameras collect snapshots and video for 10 minutes.
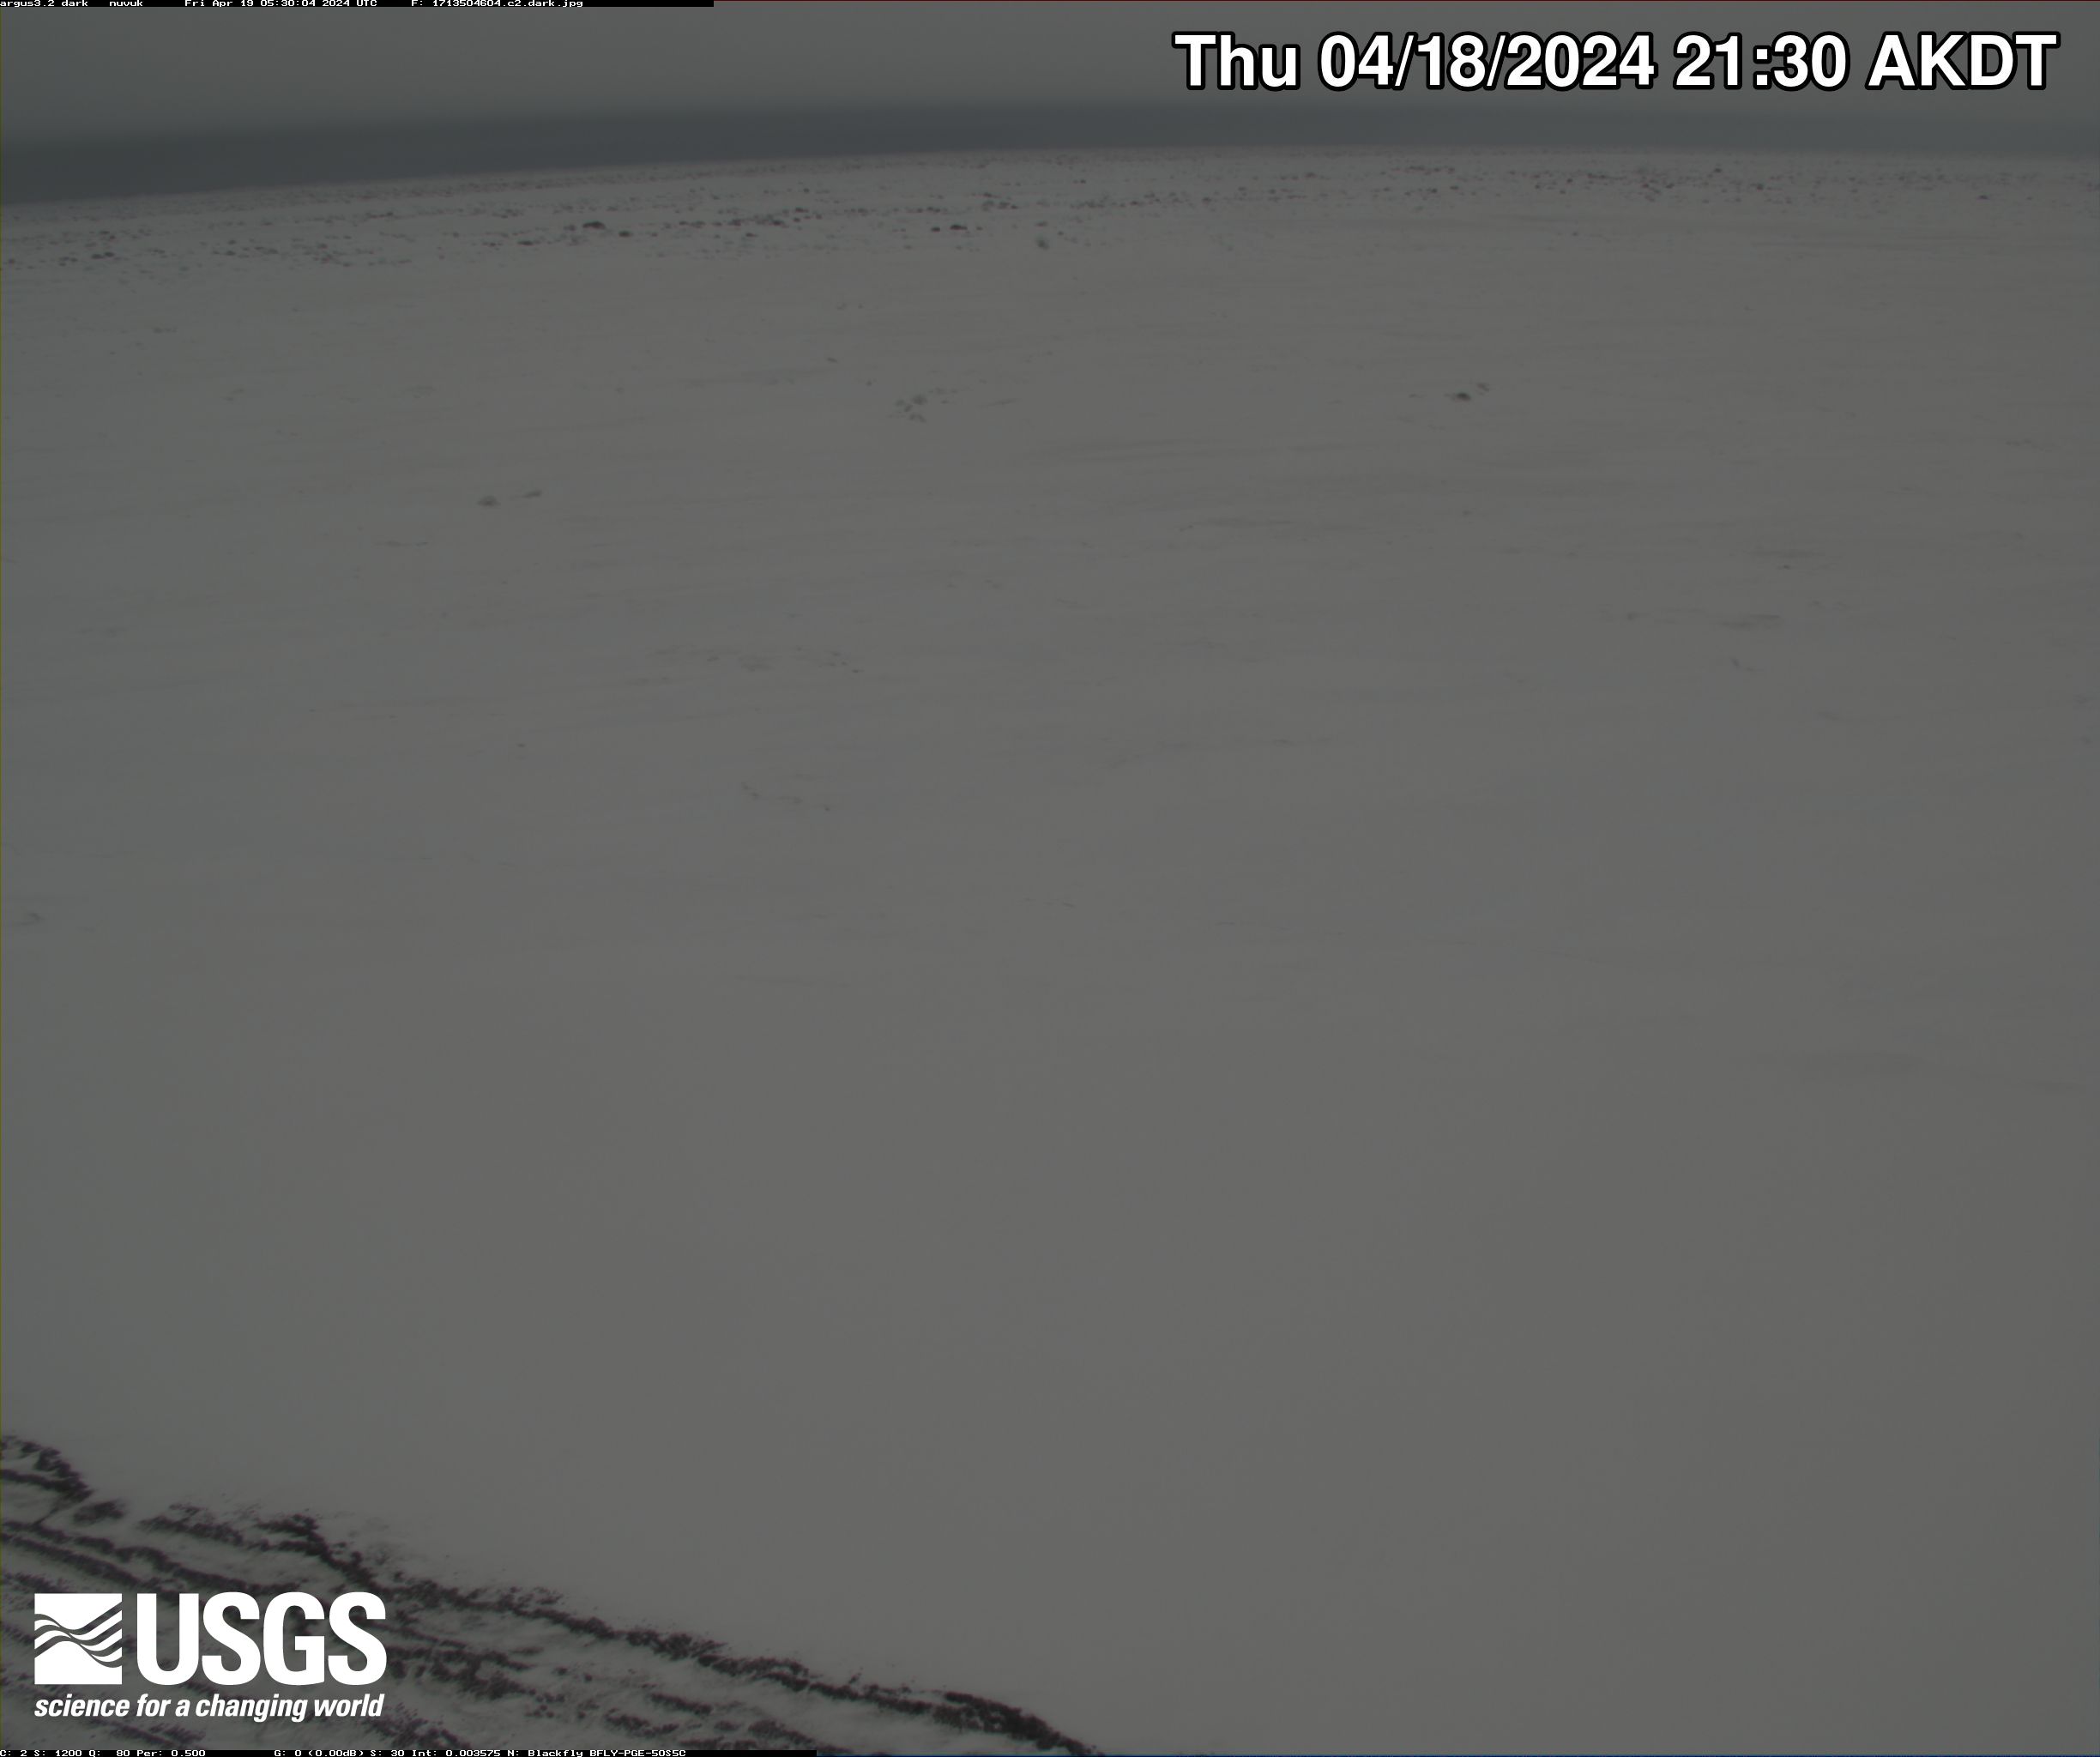
Nuvuk video camera 2 dark image
Two video cameras are installed atop a utility pole near the northernmost point of land in the United States at Nuvuk (Point Barrow), Alaska. The cameras point northwest toward the Arctic Ocean and the boundary between the Chukchi and Beaufort Seas. Every half hour during daylight hours, the cameras collect snapshots and video for 10 minutes.
Two video cameras are installed atop a utility pole near the northernmost point of land in the United States at Nuvuk (Point Barrow), Alaska. The cameras point northwest toward the Arctic Ocean and the boundary between the Chukchi and Beaufort Seas. Every half hour during daylight hours, the cameras collect snapshots and video for 10 minutes.

Nuvuk video camera 2 snapshop
Two video cameras are installed atop a utility pole near the northernmost point of land in the United States at Nuvuk (Point Barrow), Alaska. The cameras point northwest toward the Arctic Ocean and the boundary between the Chukchi and Beaufort Seas. Every half hour during daylight hours, the cameras collect snapshots and video for 10 minutes.
Two video cameras are installed atop a utility pole near the northernmost point of land in the United States at Nuvuk (Point Barrow), Alaska. The cameras point northwest toward the Arctic Ocean and the boundary between the Chukchi and Beaufort Seas. Every half hour during daylight hours, the cameras collect snapshots and video for 10 minutes.

Nuvuk video camera 1 time exposure
Two video cameras are installed atop a utility pole near the northernmost point of land in the United States at Nuvuk (Point Barrow), Alaska. The cameras point northwest toward the Arctic Ocean and the boundary between the Chukchi and Beaufort Seas. Every half hour during daylight hours, the cameras collect snapshots and video for 10 minutes.
Two video cameras are installed atop a utility pole near the northernmost point of land in the United States at Nuvuk (Point Barrow), Alaska. The cameras point northwest toward the Arctic Ocean and the boundary between the Chukchi and Beaufort Seas. Every half hour during daylight hours, the cameras collect snapshots and video for 10 minutes.

Nuvuk video camera 2 time exposure
Two video cameras are installed atop a utility pole near the northernmost point of land in the United States at Nuvuk (Point Barrow), Alaska. The cameras point northwest toward the Arctic Ocean and the boundary between the Chukchi and Beaufort Seas. Every half hour during daylight hours, the cameras collect snapshots and video for 10 minutes.
Two video cameras are installed atop a utility pole near the northernmost point of land in the United States at Nuvuk (Point Barrow), Alaska. The cameras point northwest toward the Arctic Ocean and the boundary between the Chukchi and Beaufort Seas. Every half hour during daylight hours, the cameras collect snapshots and video for 10 minutes.