U.S. flag

An official website of the United States government

Multimedia

Images

Graphic depicting 350 earthquakes that were located at Mount St. Helens between February 1 to June 17, 2024

From February 1 to June 17, 2024, approximately 350 earthquakes were located at Mount St. Helens by the Pacific Northwest Seismic Network. Over 95% of the earthquakes were less than a magnitude 1.0 and too small to be felt at the surface. The number of earthquakes located per week appears to have reached a peak in early June, at 38 events per week. USGS graphic.

From February 1 to June 17, 2024, approximately 350 earthquakes were located at Mount St. Helens by the Pacific Northwest Seismic Network. Over 95% of the earthquakes were less than a magnitude 1.0 and too small to be felt at the surface. The number of earthquakes located per week appears to have reached a peak in early June, at 38 events per week. USGS graphic.

Comparison of February-June 2024 seismicity to previous seismic swarms (1987-2004).

Comparison of February-June 2024 seismicity to previous seismic swarms (1987-2004). Upper left: Map of Mount St. Helens with a grayscale representing a digital elevation model. Earthquakes interpreted as recharge between 1987 and 2004 are plotted as a heatmap of earthquake density.

Comparison of February-June 2024 seismicity to previous seismic swarms (1987-2004). Upper left: Map of Mount St. Helens with a grayscale representing a digital elevation model. Earthquakes interpreted as recharge between 1987 and 2004 are plotted as a heatmap of earthquake density.

Earthquakes located at Mount St. Helens from 2008-2024, a non-eruptive period.

Earthquakes located at Mount St. Helens from 2008-2024, a non-eruptive period. This activity is consistent with normal, background levels. Top: Earthquake events located per week. The orange color at the far right denotes earthquakes from February to June 2024. Bottom: Earthquake depths below sea level (bsl) in kilometers.

Earthquakes located at Mount St. Helens from 2008-2024, a non-eruptive period. This activity is consistent with normal, background levels. Top: Earthquake events located per week. The orange color at the far right denotes earthquakes from February to June 2024. Bottom: Earthquake depths below sea level (bsl) in kilometers.

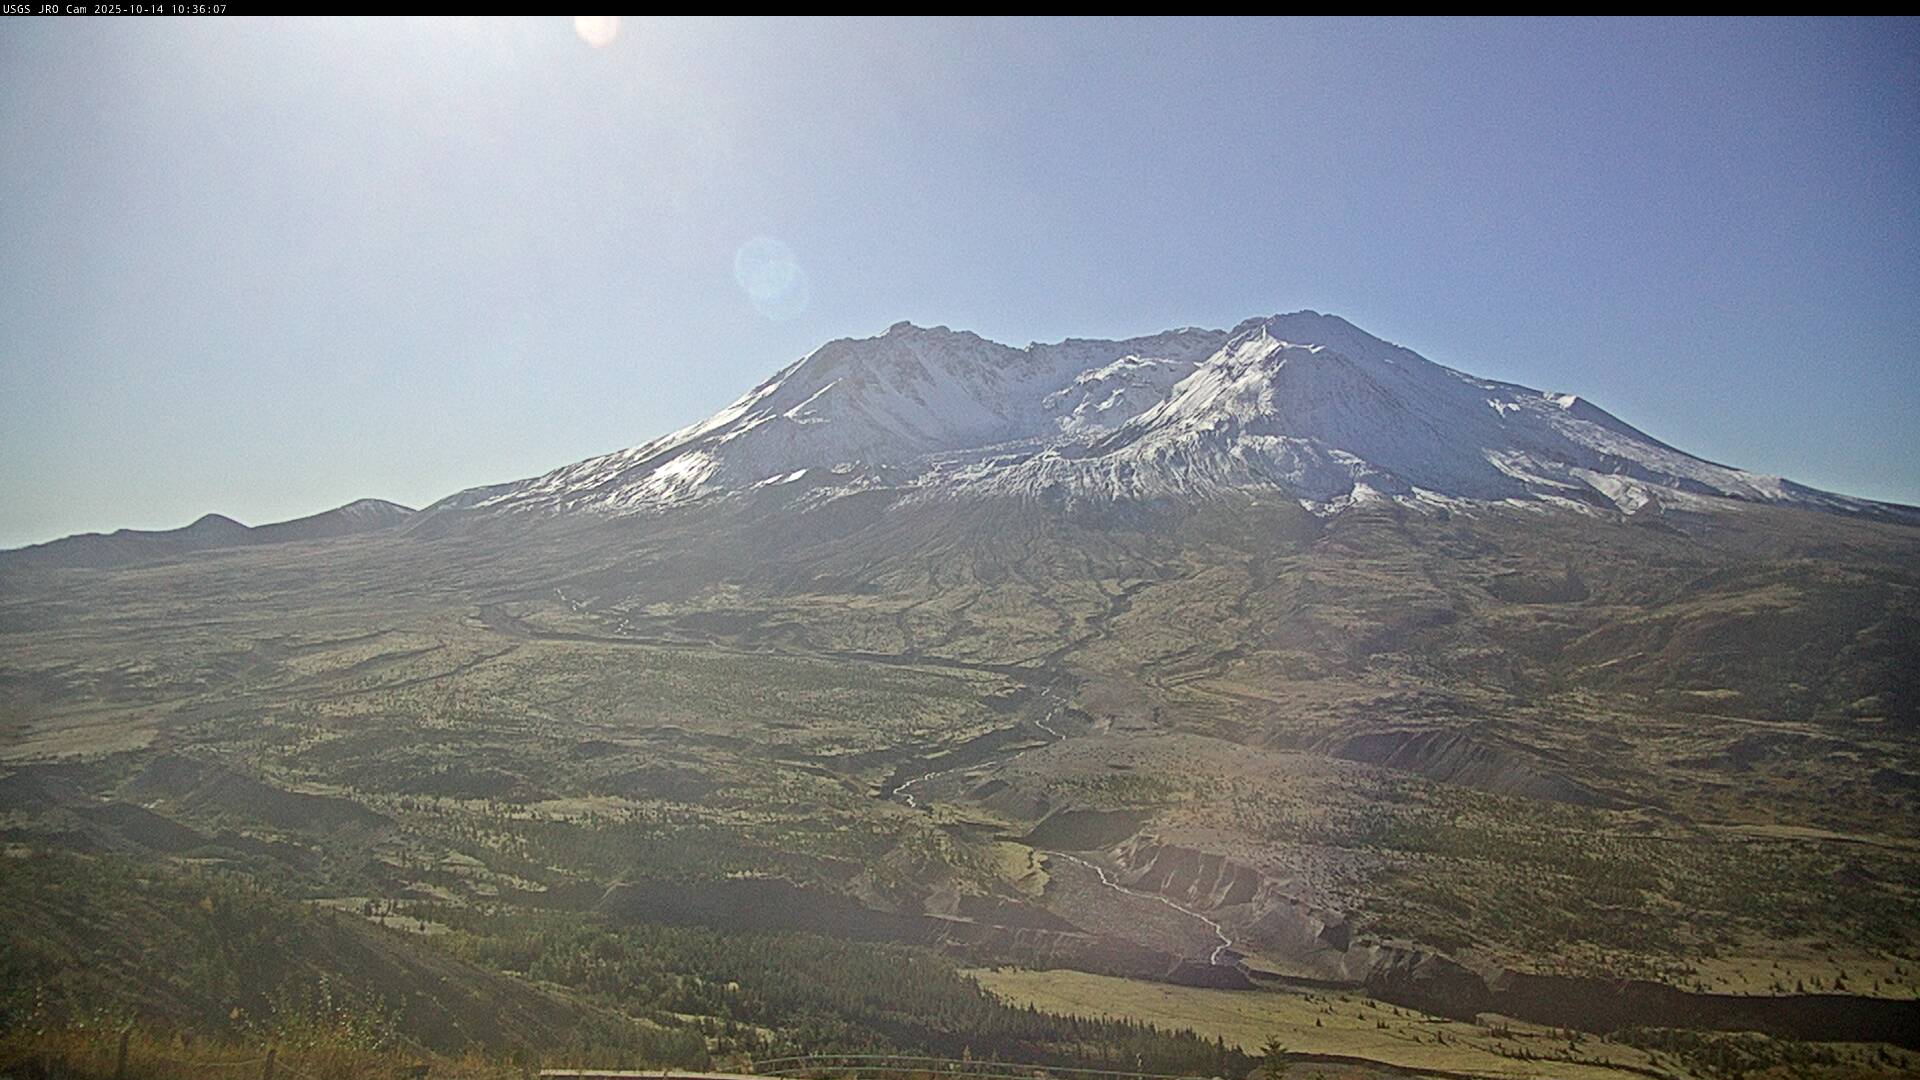
Mount St Helens with a dusting of snow looking south in June 2024
Aerial photo of Mount St. Helens June 2024

Aerial photo of Mount St. Helens (center), with Mount Hood (in the distance, far left), Spirit Lake (on left with floating log mat), and St. Helens Lake with a little ice cover (lower left). USGS image taken by K. Spicer on June 6, 2024. 

Aerial photo of Mount St. Helens (center), with Mount Hood (in the distance, far left), Spirit Lake (on left with floating log mat), and St. Helens Lake with a little ice cover (lower left). USGS image taken by K. Spicer on June 6, 2024. 

Animation of annual Yellowstone seismicity 2017-2023

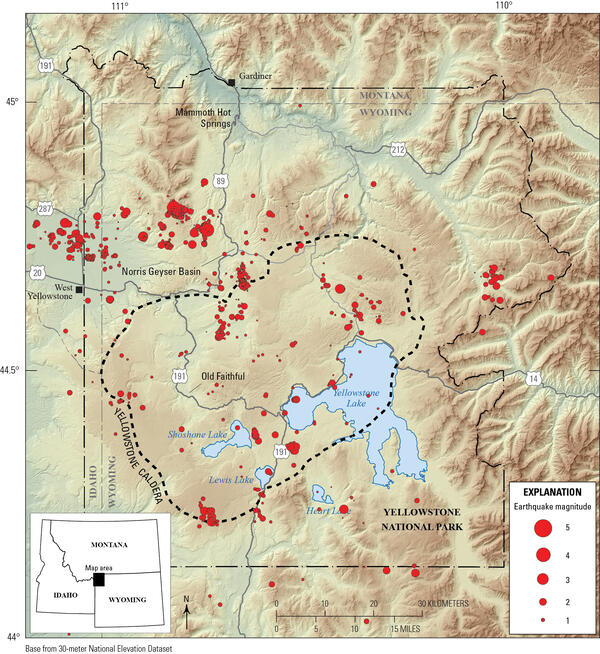
This animation shows a map of of Yellowstone seismicity by year from 2017 through 2023.  Earthquakes are red circles, with the circle size indicating earthquake magnitude.  Gray lines are roads, black dashed line shows the caldera boundary, Yellowstone National Park is outlined by black dot-dashed line, and gray dashed lines denote state boundaries.

This animation shows a map of of Yellowstone seismicity by year from 2017 through 2023.  Earthquakes are red circles, with the circle size indicating earthquake magnitude.  Gray lines are roads, black dashed line shows the caldera boundary, Yellowstone National Park is outlined by black dot-dashed line, and gray dashed lines denote state boundaries.

Infographic giving earthquake, deformation, thermal emission, and geyser statistics for the Yellowstone region for the year 2023

Infographic giving earthquake, deformation, thermal emission, and geyser statistics for the Yellowstone region for the year 2023.  The graphic accompanies the Yellowstone Volcano Observatory 2023 annual report, freely available online athttps://pubs.usgs.gov/publication/cir1524.

Infographic giving earthquake, deformation, thermal emission, and geyser statistics for the Yellowstone region for the year 2023.  The graphic accompanies the Yellowstone Volcano Observatory 2023 annual report, freely available online athttps://pubs.usgs.gov/publication/cir1524.

Videos

Man smirks with "Volcanoes in Kansas?" on top of a U.S. map with volcanic eruption in the background. Kansas covered in ash? Yellowstone's aftermath (Yellowstone Volcano Update - March 2024)
Kansas covered in ash? Yellowstone's aftermath (Yellowstone Volcano Update - March 2024)

Volcanic ash in Kansas? It's true there's thick deposits there, but where are the source volcanoes? Geologists began puzzling over this in the late 1800s when these deposits were first recognized. 

Volcanic ash in Kansas? It's true there's thick deposits there, but where are the source volcanoes? Geologists began puzzling over this in the late 1800s when these deposits were first recognized. 

Whisper or Roar? No more secrets Whisper or Roar? No More Secrets (Yellowstone Volcano Update - Feb 2024)
Whisper or Roar? No More Secrets (Yellowstone Volcano Update - Feb 2024)

If a geyser erupts and no one is there to hear it, does it make a sound? Of course it does, and now we can hear it no matter when it happens thanks to a new monitoring station in Yellowstone National Park.

If a geyser erupts and no one is there to hear it, does it make a sound? Of course it does, and now we can hear it no matter when it happens thanks to a new monitoring station in Yellowstone National Park.

Steamboat. Losing Steam? Steamboat: Losing steam?
Steamboat: Losing steam?

Steamboat Geyser is the tallest geyser in the world. It has been putting on a show the last few years for visitors at Yellowstone National Park with a record number of water eruptions, 48 eruptions each in 2019 and 2020. But it's only had eight eruptions in 2023. Is Steamboat losing steam? 

Steamboat Geyser is the tallest geyser in the world. It has been putting on a show the last few years for visitors at Yellowstone National Park with a record number of water eruptions, 48 eruptions each in 2019 and 2020. But it's only had eight eruptions in 2023. Is Steamboat losing steam? 

View of steep lava mountain with title text and description. Lava Onion? Lava flows - peeling back the layers (Yellowstone Volcano Update - November 2023)
Lava Onion? Lava flows - peeling back the layers (Yellowstone Volcano Update - November 2023)

Lava flows are one of the coolest (or maybe hottest!) features about volcanoes, but what would a lava flow look like if you could peel away the surface and take a peek underneath?

BIG EARTHQUAKE vs. BIG ERUPTION - Which is more likely at Yellowstone? Yellowstone Volcano Update — August 2023: MONUMENT TO A TRAGEDY. The origin of Hebgen Lake
Yellowstone Volcano Update — August 2023: MONUMENT TO A TRAGEDY. The origin of Hebgen Lake
Color photograph of caldera May 23, 2023 — Routine overflight of Kīlauea summit
May 23, 2023 — Routine overflight of Kīlauea summit

A routine helicopter overflight provided aerial views of Halema‘uma‘u crater, at the summit of Kīlauea. The crater floor is covered by solidified lava erupted during the previous summit eruption, earlier this year. Inflation and seismic activity in the summit region indicate ongoing unrest. USGS video by M. Patrick.

A routine helicopter overflight provided aerial views of Halema‘uma‘u crater, at the summit of Kīlauea. The crater floor is covered by solidified lava erupted during the previous summit eruption, earlier this year. Inflation and seismic activity in the summit region indicate ongoing unrest. USGS video by M. Patrick.

Webcams

Webcam image view of volcano flank
[HLcam] Live Image of Mauna Loa's northwest flank from Hualālai volcano
[HLcam] Live Image of Mauna Loa's northwest flank from Hualālai volcano
[HLcam] Live Image of Mauna Loa's northwest flank from Hualālai volcano

Live view of the northwest flank of Mauna Loa; the view is from the southeast flank of Hualālai [HLcam]. This camera is a pan-tilt-zoom model and the view may change depending on activity.

Live view of the northwest flank of Mauna Loa; the view is from the southeast flank of Hualālai [HLcam]. This camera is a pan-tilt-zoom model and the view may change depending on activity.