


Images from the Sentinel-2B satellite show the impact of 2019 Missouri River flooding on the Midwest. The first image shows the area in March of 2018, with rivers at typical levels. The second shows the Missouri River and its tributaries after heavy flooding.
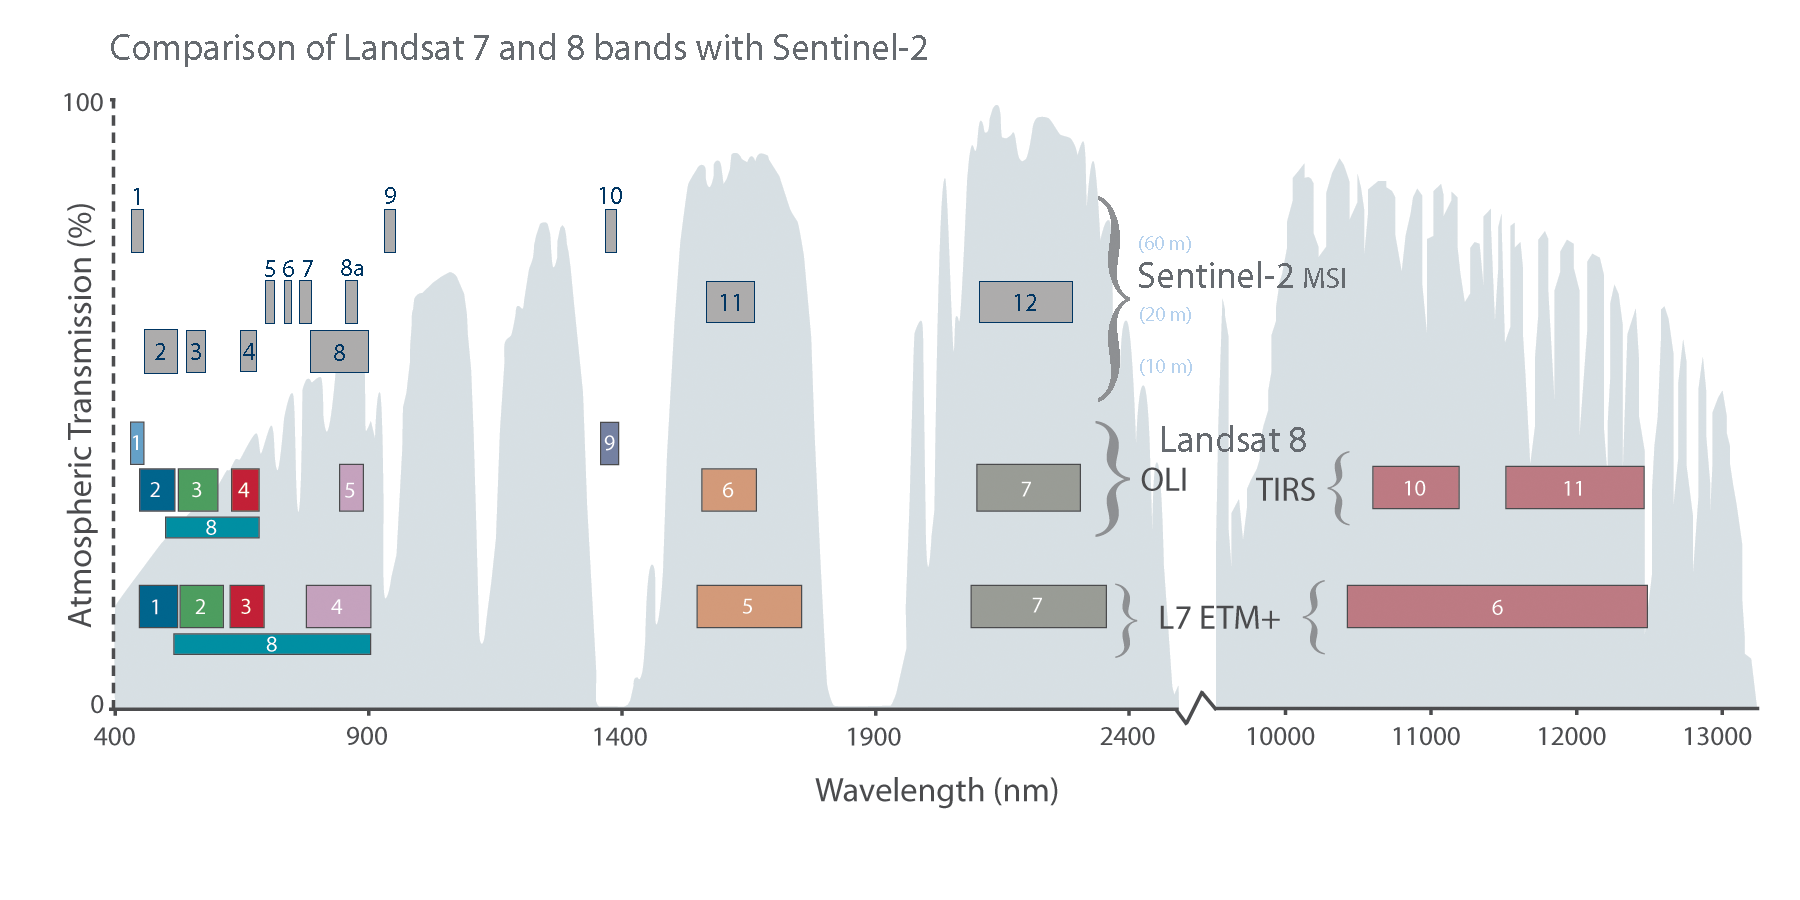
How does data from Sentinel-2A’s MultiSpectral Instrument compare to Landsat data?
The Sentinel-2A MultiSpectral Instrument (MSI) data has spectral bands very similar to Landsat 8 and 9 (excluding the thermal bands of Thermal Infrared Sensor (TIRS)).
Media

Sources/Usage: Public Domain. View Media Details
All Sentinel-2 data are freely available from the Copernicus Open Access Hub; therefore, users are encouraged to download the data via https://scihub.copernicus.eu/. To learn more about Sentinel data access information please visit: https://sentinel.esa.int/web/sentinel/sentinel-data-access. If you have questions on how to access the data from Copernicus please contact their support team at: support@copernicus.eu.
Learn more: USGS EROS Sentinel-2 Landsat Comparison
Related
What are the best Landsat spectral bands for use in my research?
The Spectral Characteristics Viewer is an interactive tool that can be used to visualize how the bands, or channels, of different satellite sensors measure the intensity of the many wavelengths (colors) of light. This is also known as the relative spectral response (RSR). By overlaying the spectral curves from different features (spectra), one can determine which bands of the selected sensor will...
Are there any restrictions on the use or redistribution of Landsat data?
There are no restrictions on Landsat data downloaded from the USGS; it can be used or redistributed as desired. We do request that you include a statement of the data source when citing, copying, or reprinting USGS Landsat data or images. Details are on the EROS Data Citation page. Learn more: USGS Copyrights and Credits statement
What are the band designations for the Landsat satellites?
The sensors onboard each of the Landsat satellites were designed to acquire data in different wavelengths in the electromagnetic spectrum. View Bandpass Wavelengths for all Landsat Sensors The Multispectral Scanner (MSS) carried on Landsat 1,2,3,4 and 5 collected data in four ranges (bands); the Thematic Mapper (TM) sensor on Landsat 4 and Landsat 5 included those bands found on earlier satellites...
Can Landsat satellite acquisition requests be made for a specific date and location?
The Landsat 8 and Landsat 9 satellites together acquire approximately 1,500 scenes daily. These scenes are available for download within 6 hours of acquisition. Landsat satellite acquisitions are managed as a system, known as a satellite constellation. Long-Term Acquisition Plans (LTAPs) direct and optimize the daily acquisitions of each active Landsat satellite. Special requests for future...
What is the Landsat satellite program and why is it important?
The Landsat Program is a series of Earth-observing satellite missions jointly managed by NASA and the U.S. Geological Survey. On July 23, 1972, in cooperation with NASA, the Earth Resources Technology Satellite (ERTS-1) was launched. It was later renamed Landsat 1. Additional Landsat satellites have launched to bring the world an archive of remote sensing data. Currently orbiting and active...
What are Landsat Collections?
In 2016, the USGS reorganized the Landsat archive into a tiered collection. This structure ensures that Landsat Level-1 products provide a consistent archive of known data quality to support time-series analyses and data “stacking”, while controlling continuous improvement of the archive and access to all data as they are acquired. Learn more: Landsat Collections Landsat Data Access
What are U.S. Landsat Analysis Ready Data (ARD)?
U.S. Landsat Analysis Ready Data (ARD) are pre-packaged and pre-processed bundles of Landsat data products that make the Landsat archive more accessible and easier to analyze, and reduce the amount of time users spend on data processing for time-series analysis. ARD contains Level-2 products derived from Landsat Collections Level-1 scenes. ARD are tiled, georegistered, top of atmosphere, and...
Why do Landsat 7 Level-1 products contain two thermal bands?
Landsat 7 acquired thermal data in two bands from one detector in both high (Band 6H) and low (Band 6L) gain. The difference in gain settings is important to different types of studies (i.e., clouds vs. deserts). Aside from the resolution differences and saturation on the high and low ends, the two bands provide the same Digital Numbers (DN) for every pixel. FILE_NAME_BAND_6_VCID_1 (band 61 or 6L)...
Missouri River Flooding - Sentinel-2B
Images from the Sentinel-2B satellite show the impact of 2019 Missouri River flooding on the Midwest. The first image shows the area in March of 2018, with rivers at typical levels. The second shows the Missouri River and its tributaries after heavy flooding.

Crater Lake Image Shows Potential of Sentinel-2A
This image from the European Space Agency's Sentinel-2A satellite offers a breathtaking view of Crater Lake National Park in southern Oregon. It offers something equally important to park managers, scientists, and anyone else interested in land cover change—a view that is highly similar and complementary to Landsat acquisitions.
This image from the European Space Agency's Sentinel-2A satellite offers a breathtaking view of Crater Lake National Park in southern Oregon. It offers something equally important to park managers, scientists, and anyone else interested in land cover change—a view that is highly similar and complementary to Landsat acquisitions.
Related
What are the best Landsat spectral bands for use in my research?
The Spectral Characteristics Viewer is an interactive tool that can be used to visualize how the bands, or channels, of different satellite sensors measure the intensity of the many wavelengths (colors) of light. This is also known as the relative spectral response (RSR). By overlaying the spectral curves from different features (spectra), one can determine which bands of the selected sensor will...
Are there any restrictions on the use or redistribution of Landsat data?
There are no restrictions on Landsat data downloaded from the USGS; it can be used or redistributed as desired. We do request that you include a statement of the data source when citing, copying, or reprinting USGS Landsat data or images. Details are on the EROS Data Citation page. Learn more: USGS Copyrights and Credits statement
What are the band designations for the Landsat satellites?
The sensors onboard each of the Landsat satellites were designed to acquire data in different wavelengths in the electromagnetic spectrum. View Bandpass Wavelengths for all Landsat Sensors The Multispectral Scanner (MSS) carried on Landsat 1,2,3,4 and 5 collected data in four ranges (bands); the Thematic Mapper (TM) sensor on Landsat 4 and Landsat 5 included those bands found on earlier satellites...
Can Landsat satellite acquisition requests be made for a specific date and location?
The Landsat 8 and Landsat 9 satellites together acquire approximately 1,500 scenes daily. These scenes are available for download within 6 hours of acquisition. Landsat satellite acquisitions are managed as a system, known as a satellite constellation. Long-Term Acquisition Plans (LTAPs) direct and optimize the daily acquisitions of each active Landsat satellite. Special requests for future...
What is the Landsat satellite program and why is it important?
The Landsat Program is a series of Earth-observing satellite missions jointly managed by NASA and the U.S. Geological Survey. On July 23, 1972, in cooperation with NASA, the Earth Resources Technology Satellite (ERTS-1) was launched. It was later renamed Landsat 1. Additional Landsat satellites have launched to bring the world an archive of remote sensing data. Currently orbiting and active...
What are Landsat Collections?
In 2016, the USGS reorganized the Landsat archive into a tiered collection. This structure ensures that Landsat Level-1 products provide a consistent archive of known data quality to support time-series analyses and data “stacking”, while controlling continuous improvement of the archive and access to all data as they are acquired. Learn more: Landsat Collections Landsat Data Access
What are U.S. Landsat Analysis Ready Data (ARD)?
U.S. Landsat Analysis Ready Data (ARD) are pre-packaged and pre-processed bundles of Landsat data products that make the Landsat archive more accessible and easier to analyze, and reduce the amount of time users spend on data processing for time-series analysis. ARD contains Level-2 products derived from Landsat Collections Level-1 scenes. ARD are tiled, georegistered, top of atmosphere, and...
Why do Landsat 7 Level-1 products contain two thermal bands?
Landsat 7 acquired thermal data in two bands from one detector in both high (Band 6H) and low (Band 6L) gain. The difference in gain settings is important to different types of studies (i.e., clouds vs. deserts). Aside from the resolution differences and saturation on the high and low ends, the two bands provide the same Digital Numbers (DN) for every pixel. FILE_NAME_BAND_6_VCID_1 (band 61 or 6L)...
Missouri River Flooding - Sentinel-2B
Images from the Sentinel-2B satellite show the impact of 2019 Missouri River flooding on the Midwest. The first image shows the area in March of 2018, with rivers at typical levels. The second shows the Missouri River and its tributaries after heavy flooding.
Images from the Sentinel-2B satellite show the impact of 2019 Missouri River flooding on the Midwest. The first image shows the area in March of 2018, with rivers at typical levels. The second shows the Missouri River and its tributaries after heavy flooding.
Crater Lake Image Shows Potential of Sentinel-2A
This image from the European Space Agency's Sentinel-2A satellite offers a breathtaking view of Crater Lake National Park in southern Oregon. It offers something equally important to park managers, scientists, and anyone else interested in land cover change—a view that is highly similar and complementary to Landsat acquisitions.
This image from the European Space Agency's Sentinel-2A satellite offers a breathtaking view of Crater Lake National Park in southern Oregon. It offers something equally important to park managers, scientists, and anyone else interested in land cover change—a view that is highly similar and complementary to Landsat acquisitions.
Updated Date: January 10, 2023